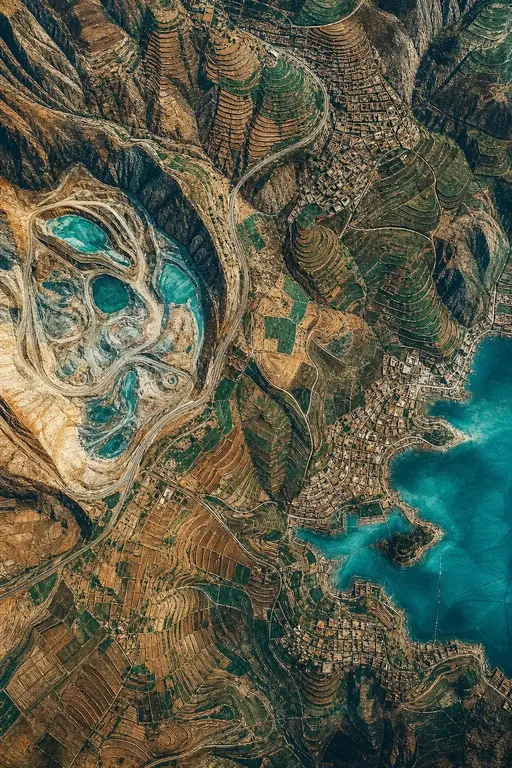
From features to fingerprints: A general diagnostic framework for anthropogenic geomorphology

1. From features to fingerprints: A general diagnostic framework for anthropogenic geomorphology
Progress in Physical Geography
2019, Vol. 43(1) 95–128
© The Author(s) 2019
Article reuse guidelines:
DOI: 10.1177/0309133318825284

 and Wenfang Cao
University of Padova, Italy
University of Padova, Italy; University of Connecticut, USA

École Française d'Extrême-Orient, France

University of Maryland, Baltimore County, USA
1.1. Abstract
Human societies have been reshaping the geomorphology of landscapes for thousands of years, producing anthropogenic geomorphic features ranging from earthworks and reservoirs to settlements, roads, canals, ditches and plough furrows that have distinct characteristics compared with landforms produced by natural processes. Physical geographers have long recognized the widespread importance of these features in altering landforms and geomorphic processes, including hydrologic flows and stores, to processes of soil erosion and deposition. In many of the same landscapes, archaeologists have also utilized anthropogenic geomorphic features to detect and analyse human societal activities, including symbolic formations, agricultural systems, settlement patterns and trade networks. This paper provides a general framework aimed at integrating geophysical and archaeological approaches to observing, identifying and interpreting the full range of anthropogenic geomorphic features based on their structure and functioning, both individually and as components of landscape-scale management strategies by different societies, or “sociocultural fingerprints”. We then couple this framework with new algorithms developed to detect anthropogenic geomorphic features using precisely detailed three-dimensional reconstructions of landscape surface structure derived from LiDAR and computer vision photogrammetry. Human societies are now transforming the geomorphology of landscapes at increasing rates and scales across the globe. To understand the causes and consequences of these transformations and contribute to building sustainable futures, the science of physical geography must advance towards empirical and theoretical frameworks that integrate the natural and sociocultural forces that are now the main shapers of Earth’s surface processes.
1.2. Keywords
Geomorphology, Anthropocene, landscapes, society, earth, humans, history, archaeology, remote sensing
1.3. Corresponding author:
Paolo Tarolli, Department of Land, Environment, Agriculture and Forestry – University of Padova, Agripolis, Viale dell’Università 16, Italy.
1.4. I Introduction
Before humans left their first footprints on African landscapes, Earth's terrestrial surface was shaped solely by the natural geophysical processes of climate, tectonic uplift, volcanism and the erosion, transport and deposition of sediments, modified only by the ecosystem engineering activities of microbes, plants and animals (Erwin, 2008). While these processes continue to operate, human societies have increasingly gained the capacity to act as a novel force of geomorphic change, both adding to and interacting with pre-existing natural biogeophysical forces in shaping landscapes through activities ranging from the clearing of land using fire and the tillage of soils for agriculture, to the construction of settlements, dams, mines, canals, roads and other infrastructures (Brown et al., 2017; Cuff, 2008; Dixon et al., 2015; Edgeworth, 2014; Edgeworth et al., 2015; Ellis, 2015; Ellis and Haff, 2009; Foley and Lahr, 2015; Goudie, 2018; Goudie and Viles, 2016; Guthrie, 2015; Hooke and Martin-Duque, 2012; Kirch, 2005; Lewis and Maslin, 2015; Sauer, 1925; Tarolli, 2014, 2016; Tarolli and Sofia, 2016; Tarolli et al., 2014, 2018; Waters et al., 2016; Zalasiewicz et al., 2017). As a result, a complete assessment and understanding of the formation and evolution of Earth's current landforms requires a robust theoretical understanding of the anthropogenic processes that have assisted in shaping them.
The science of physical geography and that of geomorphology, in particular, requires new tools and frameworks capable of identifying and interpreting anthropogenic geomorphic features together with the sociocultural processes that have shaped them (Ellis, 2017). The goal here is to help advance such a framework by connecting existing theories on human sociocultural processes with the observational techniques needed to identify the full spectrum of geomorphic products of these processes, both as
individual "anthropogenic features" and their diagnostic interpretation as the geomorphic "sociocultural fingerprints" produced across landscapes by specific human societies. To do this, we integrate archaeological, ecological and geophysical frameworks around theory on sociocultural niche construction (Ellis, 2015; Ellis et al., 2018), building on existing published work on anthropogenic geomorphology (Brown et al., 2017; Goudie and Viles, 2016; Johnson and Ouimet, 2018; Li et al., 2017; Szabo, 2010; Tarolli and Sofia, 2016; Tarolli et al., 2018).
1.4.1. 1.1 Anthropogenic landscapes are sociocultural palimpsests
While many species alter their environments, humans are Earth's ultimate ecosystem engineers, engaging in a broader range of more potent environment-modifying behaviours than any other species (Smith, 2007; Smith and Zeder, 2013). By engineering environments using fire, tools of increasingly complex design and domesticated species, and by harnessing non-human energy to accomplish these modifications, human niche construction practices have radically enhanced the adaptive fitness of human individuals, social groups and societies, enabling human societies to increase in scale and to extend their reach across Earth's terrestrial surface (Ellis, 2015; Ellis et al., 2018). Most importantly, human capacities to engineer environments are not biological, but sociocultural, and these sociocultural capacities have evolved and accumulated over time together with human capacities for cooperation and social learning (Ellis, 2015; Ellis et al., 2018) (Figure 1). Human sociocultural niche construction has diversified, scaled up and utilized increasing amounts of energy over millennia, from the first use of fire to clear land (for greater success in hunting and foraging), to the construction and management of agricultural landscapes using animal labour, to urban settlements powered by fossil fuels, to the global networks of exchange infrastructure that have made contemporary human societies the most interdependent in history and have made humanity a global force of nature (Figure 1).

The diagram illustrates the evolution of human societies through various stages, categorized into five main horizontal tracks. The stages are defined by time periods at the top: Hunter Gatherer (Palaeolithic Lower, Upper, Mesolithic), Simple Horticultural (Early Neolithic), Advanced Horticultural (Later Neolithic & Chalcolithic), Simple Agrarian (Bronze Age), Advanced Agrarian (Iron Age), Industrial (Industrial Age), and Post-Industrial (Emerging Futures).
- Sociocultural Systems: A purple arrow showing the progression from Hunter Gatherer (Cooking, Land clearing, Segmentary Tribes) through Simple Horticultural (Villages, Domestication, Agriculture, Ceramics) and Advanced Horticultural (Chiefdoms, Textiles, Copper, Plow) to Simple Agrarian (States, Urbanization, Bronze, Sailing ships), Advanced Agrarian (Empires, Continental trade, Iron smelting), Industrial (Capitalism, Global trade, Fossil fuels), and Post-Industrial (Internet, Automation, Sustainability?).
- Cultural Inheritances: A red arrow showing the progression from Hunter Gatherer (Fire, Symbols, Languages, Trade, Burial rituals) through Simple Horticultural (Cultivation, Herding, Ritual specialization, Geoglyphs) and Advanced Horticultural (Weaving, Smelting, Craft specialization, Monumental burial) to Simple Agrarian (Numeracy, Literacy, Political specialization, Reservoirs), Advanced Agrarian (Taxation, Military, International trade, Printing, Money), Industrial (Mechanization, Synthetics, Scientific specialization), and Post-Industrial (Telecommunication, Computation, Robotics).
- Social Scales: A yellow arrow showing the progression from Hunter Gatherer (Kinship, Small Bands, Social Status: Achieved) through Simple Horticultural (Segmentary tribes, Raiding, Trading, Debt Slavery) and Advanced Horticultural (Villages) to Simple Agrarian (Chiefdoms, Kingdoms, States) and Advanced Agrarian (Empires). The Industrial and Post-Industrial stages are labeled 'Socioeconomic' and include Federated states and Beyond states?.
- Energy use: A green arrow showing the progression from Hunter Gatherer (Cooking) through Simple Horticultural (Burning) and Advanced Horticultural (Smelting) to Simple Agrarian (Animal Traction) and Advanced Agrarian (Biomass). The Industrial stage is labeled 'Fossil' and the Post-Industrial stage is labeled 'Abiotic'.
- Anthropogenic Geomorphic Features: A grey arrow showing the progression from Hunter Gatherer (Hearths) through Simple Horticultural (Ditches, Graves, Middens, Postholes, Buildings, Megaliths) and Advanced Horticultural (Terraces, Monuments, Mines, Boundary walls) to Simple Agrarian (Embankments, Cities, Ports, Canals, Improved roads, Concrete structures) and Advanced Agrarian (Sewers, Factories, Railroads). The Industrial and Post-Industrial stages include Powerlines, Telecom infrastructure, Brownfields, Constructed wetlands, Highways, and Airports.
A scale at the bottom right indicates energy use in .
Figure 1. Conceptual diagram of long-term changes in sociocultural systems, cultural inheritances, societal scale, energy use and anthropogenic geomorphic features. Different societies combine different sets of anthropogenic geomorphic features, including both pre-existing and novel, to produce their sociocultural fingerprints across landscapes (this figure expands on Ellis, 2015, Figure 3 and Ellis et al., 2018, Figure 1).
Human modification of landscapes has tended to increase in scale and complexity together with the scale and complexity of human societies (Ellis, 2015). By the Late Pleistocene, opportunistic use of naturally occurring fire was supplemented by technologies of fire-maintenance and fire-making (Sandgate and Berna, 2017), amplifying the ability of humans to transform ecosystems and the erosive and
hydrologic processes accompanying land clearing over extensive areas, either intentionally or unintentionally. The construction of settlements by sedentary hunter-gatherers and early farmers left more robust geomorphic evidence due to the systematic and deliberate reconfiguration of landscapes, often reflecting distinctive patterns in social behaviour and material culture (Fletcher, 2009). As societies scaled up over time, into the first agricultural, urbanized and then industrial societies, their ecosystem engineering also increased in scale, complexity, durability and in the sheer amounts of material moved (Figure 1).
Even more significant complexity in anthropogenic landforms has emerged over time, as the geomorphic features engineered in support of one society have come to be inherited by, overlaid by, overwritten and reconstructed by later societies, such that the anthropogenic features and landforms of regions with sustained human occupation represent not the directed efforts of a single society, but rather the complex sociocultural palimpsests of multiple diverse societies (Bailey, 2007). Moreover, given that natural geomorphic processes continue to act during and after societal processes, the landform palimpsests of anthropogenic landscapes represent the sustained interplay of sociocultural and biogeophysical processes over time (Johnson and Ouimet, 2018).
1.4.2. 1.2 Anthropogenic features and sociocultural fingerprints
Individual anthropogenic features, as specific human modifications of land surfaces such as an individual graves, buildings or roads, show a wide variety of forms. In aggregate, however, the anthropogenic features produced by a given society may evince a degree of consistency within a given sociocultural milieu, as illustrated in Figure 1. Thus, as archaeologists have long recognized, the material cultures of different societies pattern the surface of Earth in specific ways that produce distinctive and recognizable sociocultural fingerprints (Butzer, 1974; 1982; David and Thomas, 2016).
Anthropogenic landforms have tended to increase in scale and complexity in parallel with the scale and complexity of the societies that produce them. Composed of individual land surface modifications, or “anthropogenic features”, these are the products of socially and culturally directed efforts by individuals and social groups, increasingly assisted by animal labour, fossil-fuelled machinery and other non-human energy, to remove, transfer, introduce and reshape elements of the physical environment to achieve the
goals of these individuals, social groups and entire societies. This social production of space generates a virtually endless variety of physical forms. We must therefore acknowledge at the outset the difficulties in dividing such myriad diversity of physical forms into neat categories according to their perceived function or meaning. Elements of material culture can, of course, be multifunctional, and polysemic, in ways that are arbitrary, unknowable and subject to variability over time. We argue, however, that there is practical and heuristic value in structuring the complexity of these physical forms into a generalized ontology of anthropogenic features, as in Figure 2: symbolic (e.g. graves and monuments), habitation (e.g. housing, villages, cities), transport and exchange (e.g. roads, canals), subsistence (e.g. plough furrows, irrigation networks), mining, refuse disposal and warfare (forts and battlements), among others.
Individual anthropogenic features are readily detectable on Earth’s surface (or below) through observations made on their geometric forms, and possibly through a range of other physical or chemical attributes. Smaller scale societies, such as those of the first farmers, tend to produce a relatively narrow range of anthropogenic features. However, even small-scale societies produce a diversity of distinctive anthropogenic features on the landscape within the framework of their material culture. For example, a horticultural society produces building and settlement structures, hand-tilled fields, waste middens and graves, while the material culture of more complex societies is characterized by large-scale urbanism, ploughed fields, irrigation systems, mines and quarries, roads, monuments, cemeteries and many other anthropogenic features. These individual features are the fundamental elements of material culture at the landscape scale and, considered in aggregate, it is possible to identify the distinctive spatial patterning of a society elaborated across time and space on the surface of Earth: the sociocultural fingerprints of societies and cultures. The
| Features | Description | Function | |||
|---|---|---|---|---|---|
| Hearth-pits | Bowl-shaped, ash deposits, soil discoloration; shallow (depth generally less than 0.5 m) and small (diameter less than 1 m) | Subsistence: cooking, heat, firing of ceramics; limited metallurgy |  | ||
| Burial sites | Excavations, mounds, cemeteries including human remains | Symbolic: repository for human remains |  |  | 0 50 m |
| Geoglyphs | Human rearrangement of earth, stone and other materials to create symbolic anthropogenic landforms | Symbolic: Public and ceremonial spaces, burial sites, funerary customs, animal trapping |  |  | 0 12 m |
| Rock-Shelter | Natural rock formations associated with ancient human habitation, including campfires, remains, debris | Habitation, shelter |  | ||
| Megaliths | Human-rearranged stones without mortar or concrete | Symbolic: Monumental architecture, ceremonial spaces |  |  | 0 80 m |
| Buildings | Permanent structures with roof and walls | Habitation, storage, symbolic structures, other functions requiring permanent sites with protection from weather |  |  | 0 80 m |
| Cities | Permanent large-scale human settlement, including infrastructure | Habitation, trade; centers of human social interaction |  |  | 0 40 m |
| Boundary walls | Linear raised features composed of earth, rock, wood, brick and other materials | Protection of settlements, fortresses, and farms from potential aggression |  |  | 0 50 m |
| Roads | Cleared, levelled, sometimes paved, interconnected linear features | Transport: mobility for humans, livestock, vehicles, and exchange of materials among settlements |  |  | 0 100 m |
| Middens | Mounds of domestic refuse containing shells, animal bones and other debris and remains marking sites of prehistoric settlement | Refuse disposal |  |  | 0 80 m |
| Livestock trails | Animal-induced paths trampled into earth, often interconnecting water and shelter | Subsistence: livestock production |  |  | 0 50 m |
| Terraces | Artificially-levelled shelves of land interrupting slopes | Subsistence: facilitating crop production on steep slopes |  |  | 0 100 m |
| Mines | Excavations maintained for mineral extraction | Source of mineral resources, ore for metallurgy, clay for bricks, etc. |  |  | 0 1000 m |
| Ditches | Narrow channels excavated around crop fields, buildings and road perimeters | Drainage of settlements, roads, agricultural land, and water transport for irrigation |  |  | 0 50 m |
Figure 2. Examples of anthropogenic geomorphic features, their sociocultural functions, and derived fingerprint on topography. From top to bottom: hearth-pit (Shahack-Gross et al., 2014); West Kennet Long Barrow in Avebury, Wiltshire (UK), one of the largest and most impressive Neolithic graves in Britain (3650 BC) (ph: © Skyscan Balloon Photography; LiDAR: Survey Open Data UK); The Long Man of Wilmington on South Downs in Sussex,

| Canals | Large-scale, artificial linear excavations | Transport of materials and people by boat, and water transport for irrigation | |
| Embankments | Artificial mounds and structures of earth, stone and other materials along waterways | Supporting infrastructure for flood protection from, and access to waterways | |
| Reservoirs | Artificial lakes | Water infrastructure, water storage, hydraulic power, aquaculture | |
| Constructed wetlands | Flooded excavations | Drainage, water treatment | |
| Trenches | Long, narrow excavations | Warfare: protection of military personnel |
Figure 2. (Continued). UK (ph. Steve Slater, LiDAR: Survey Open Data UK); rock shelter (ph. Bernard Gagnon); Stonehenge (UK) (LiDAR: Survey Open Data UK); building in Lugo (Spain) (ph. Luis Miguel Bugallo Sánchez; LiDAR: © Centro Nacional de Información Geográfica); El Tolmo (Spain), archaeological site showing a continuous time record of ancient civilizations from 3500 yr BP onwards (ph. Laclac; LiDAR: © Centro Nacional de Información Geográfica); Roman wall of Lugo (Spain) (ph. Xosema; LiDAR: © Centro Nacional de Información Geográfica); mountain road (ph. Chell Hill, LiDAR: OpenTopography Facility); shell middens at Mound Key (Florida) (http://www.flpublicarchaeology.org/blog/crc/tag/soil-core/; LiDAR: NOAA National Oceanic Atmospheric Association website); cow trails (ph. Herzi Pinki, LiDAR: LiDAR Laserscanning-Geodaten Kanton Zürich, Amt für Raumentwicklung Geoinformation GIS-Produkte); rice terraces in the Philippines (University of the Philippines TCAGP); Bingham Canyon copper mine, UT, USA (ph. Spencer Musick; LiDAR: MNTOP®); agricultural ditch in the Netherlands (ph. Tup Wanders, LiDAR: Dutch National Spatial Data Infrastructure – PDOK); the Mittellandkanal, the longest artificial waterway in Germany (LiDAR: Geschäftsstelle des IMA GDI Nordrhein-Westfalen); riverbank in Italy (Google ©2017; LiDAR: Italian Ministry of Environment); Leech Lake Minnesota (LiDAR: MNTOP®); constructed wetland in Northern Italy (Ph Adige Euganeo; LiDAR: Italian Ministry of Environment); Nagia Grom war trenches in northern Italy (ph. Kevin1971; LiDAR: Autonomous Province of Trento).
layering of these sociocultural fingerprints over landscapes over time, and their interactions with each other and the natural geomorphic processes that simultaneously shape them, combine to produce the landforms that cover most of Earth’s terrestrial surface today.
1.4.3. 1.3 Understanding the socioeconomic and sociocultural drivers of anthropogenic landscape evolution
To understand the socioeconomic and sociocultural forces that shape landscapes, it is first
necessary to recognize that these operate at the scale of the societies engaging in them (Ellis, 2015). Human societies have long shaped terrain at local and regional scales. Now, human societies numbering in the billions are reshaping landforms globally through global-scale processes enabled by interconnected systems of economic, social, material and energy exchange, increasing levels of technological innovation and rapid socioeconomic development (Fox et al., 2017; Zalasiewicz et al., 2017). Yet, even while the anthropogenic features and fingerprints generated by societies have tended to extend spatially across their areas of influence, their distributions are usually highly heterogeneous within and across these areas. Societal demands for food, minerals, settlements, economic exchange, symbolic communications and other needs are generally expressed unevenly across societal areas of influence to access the distribution of opportunities afforded by natural patterns of resource-use potential, such as fertile soils, level terrain, access to water and other societally perceived patterns defining their suitability for different uses, and also based on pre-existing social structures, such as settlements, transport infrastructures and areas of symbolic significance that define their value and accessibility for societal use (Butzer, 1982b; Ellis, 2015).
The economic and social demands of global-scale societies are now met through processes that engage with social and environmental differences around the world at regional scales – where land, resources and labour are less expensive and more accessible. As a result, as socioeconomic demands and exchange processes have scaled up, some world regions are experiencing rapid increases in anthropogenic modification caused by deforestation and tillage to meet far-away food demands, road-building to interconnect global supply chains or dam construction to supply energy, while at the same time other regions are experiencing rapid decreases in such modifications and even complete abandonment by human populations (Meyfroidt et al., 2013). While uneven spatial patterns of anthropogenic landscape modification are just as common in small-scale societies, they tend to be produced by very different socioeconomic and sociocultural processes. In general, the forms, extents and distributions of anthropogenic landscape modifications must all be seen as variable across and within societies as a function of both pre-existing natural patterns, largely related to terrain and climate, and to pre-existing sociocultural patterns, largely related to the cultural and technological capacities and patterns of social structures in space, and the
varying interactions of different societies with these conditions (Butzer, 1982b; Ellis, 2015).
Anthropogenic landscape modifications are therefore a combination of cultural forms, technologies and natural environmental patterns, and can involve anthropogenic interventions that accelerate or delay natural geomorphological processes, producing hybrid anthropogenic/natural features, or engineer entirely distinct anthropogenic features with purely cultural functions. For this reason, anthropogenic landforms vary widely in form and function, in the degree to which they are distinct in their spatial patterning from natural landforms and in the degree to which they may be recognized as the product of a specific cultural milieu. Whereas natural mass flows generally move from high to low positions or from upstream to downstream under the influence of natural forces, and their capacity to move dissipates over distance, landforms engineered through direct human agency are shaped primarily by social and cultural imperatives that produce landforms distinctly different from natural physical processes. Anthropogenic landscape engineering often represents elaborate attempts to subvert natural processes in culturally specific ways – by damming floodplains and diverting sediment-laden floodwaters into walled field systems, for example – which can in turn feed back into natural systems and generate consequential changes within them. To understand human modifications of landscape evolution across multiple scales of time and space, a basic framework for describing and classifying anthropogenic landforms is needed, together with an understanding of the underlying generative principles that produce them, and the nature and degree of their ability to alter the functioning of landscapes.
1.5. II The diversity of anthropogenic geomorphic features
In this work we use the following categories to establish a basic, working framework for the classification of anthropogenic features: (i) symbolic; (ii) habitation; (iii) transport/exchange; (iv) subsistence; (v) mining; (vi) water infrastructure; (vii) waste disposal; (viii) warfare. These heuristic categories encompass signatures of social functions in space and time. Features identified within these categories cover different spatio-temporal extents, and are affected differently by time-varying processes. As a consequence, the anthropogenic features described within these categories exist across a spectrum of scales in space and time, and also reflect a huge range of societal scales and complexities, from hearth pits to highway networks. The landscapes within which these features are embedded are also a function of spatio-temporal scale, depending on the overall area encompassed by a society (its extent in space) and its historical development (extent in time). When viewed at larger spatial scales, combinations of these features represent fingerprints of societal functions, from agriculture and settlements to industrial development, transport infrastructure and other functions. Even at the level of individual features, which range from small (<1 m) to large (>1 km) in size, it can also be possible to identify specific societies directly from their anthropogenic landforms and features (Figure 2).
1.5.1. 2.1 Symbolic
The first symbolic features of human societies are likely burial sites (Belmonte, 2014). Entombments in ancient times have included caves and underground burials with different designs relating to the wealth and status of the deceased (Cuezva et al., 2016). As societies evolve, so have burial practices, from ground and cave burials to more elaborate constructions (Sidebotham, 2014; Tomczyk et al., 2011). In many cultural contexts these funerary structures represent massive investments in reconfiguring the natural landscape, and their sheer size makes them relatively resistant to natural weathering and degradation
(Guthrie, 2015). In some instances, for example with geoglyphs, it is clear that landscape-scale transformations of the natural environment have been undertaken in order to encode meaning in geometric patterns (Briones-M, 2006; Tapete et al., 2013, 2017). Geoglyphs can play a role in mortuary practices as well as aiding in the trapping of migratory animals, and serving as cleared areas for camps, houses and animal enclosures (Kennedy, 2011). They are formed of durable materials such as soil, stones, clastic rocks, live trees, gravel and earthworks (Sparavigna, 2010). Prehistoric agricultural societies, especially in parts of Europe, also produced large stone structures, or megaliths, including large single standing stones, as part of buildings, as portal dolmens, rotundas and passage graves, as well as henges, all of which served diverse but essential societal functions (Beck and Chrisomalis, 2008; Fleming, 1999, 2005; Holtorf, 1998; Midgley, 2010). Historical and contemporary societies also produce a wide variety of symbolic landscape features in parks and gardens, including stylized berms incorporated into artworks, and many shaped to mimic stylized natural landforms, such as those of central park in New York City (Portal, 2017).
1.5.2. 2.2 Habitation
Early human encampments relied on rock shelters formed by natural processes, such as caves (Farrand, 2001; Judson et al., 2005; Simms and Russell, 1997), whose natural and anthropogenic deposits offer details on human activities, natural environments inside such caves and their dynamic interactions over time (Courty and Vallverdu, 2001; Farrand, 2001). With the rise of sedentary societies, especially those sustained by agriculture, people began to build more permanent shelters and to concentrate these in ever larger settlements, from seasonal encampments, to villages, towns, cities and ultimately into interlinked complexes of urban and rural landscapes sustaining large-scale social formations, or states (Goudie and Viles, 2016).
As settlements grew in scale, these came to include not only housing but also specialized buildings for governance, crafts production, temples and other cultural needs, water infrastructure, road networks and boundary walls or fortifications (Beranek, 1988; Campbell, 2006; van der Spek, 2017). Many early cities prospered, dwindled and disappeared, such as the Mesopotamian city of Ur, in ruins by 450 BCE (Azara, 2015; Launderville, 2013). Other ancient cities have survived to the present, such as Jericho, one of the oldest inhabited cities in the world, well-known for its protective walls (Issar, 2008). As with Jericho, defensive enclosures are one of the most easily recognizable components of the archaeological record (Boyce et al., 2015; Cassel, 2012; Rojas, 2010). Other urban forms include the large-scale urban complexes and hydraulic systems that evolved in densely forested landscapes in Asia and Amazonia (Evans et al., 2013; Liu et al., 2017; Roberts et al., 2017). The production of built structures, from walls to housing and those for other specialized purposes, induces a variety of geomorphic processes ranging from concentrated excavation to the intensive transport, deposition and restructuring of materials, to the creation of new artificial landforms. All of these intentional structuring processes tend to further enhance other geomorphic processes, including water accumulation, the deposition of waste materials in excavated areas, destabilizing of new landforms and underground structures, intensified erosion and other environmental consequences (Courtney and Vallverdu, 2001; Farrand, 2001).
1.5.3. 2.3 Transport/exchange networks
Urban development is also accompanied and facilitated by the development of transport networks composed of paths, unimproved and improved roads, railways and waterways connecting rural resources and people to distant markets and population centres (Bell and Iida,
1997; Kara and Verter, 2004; Morriss, 2003, 2005; Ruiz, 2016; Snead et al., 2009). Roads are ubiquitous features of landscapes and different shapes of road network represent the different evolution of civilization at different times (Strano et al., 2012). Road networks can reflect the central or decentralized organization of countries, and provide important pathways for mobility, migration and demographic change. They induce the rural to urban migrations as well as the massive emigration. In addition, since the Industrial Revolution, railroads have been an important form of transportation (Li, 2017; Morriss, 2003), shaping not only cities and economic growth (Hanedar, 2017; Nerlove, 1966), but also landscape processes (Bell and Iida, 1997; Blanton and Marcus, 2009, 2013; Kumar et al., 2014; Martinović et al., 2018). Railways, for example, can induce selective disclosure of the countryside (Antrop, 2004). Villages that received a station in some cases (but not always) developed rapidly into urban-like centres and their surrounding landscape changed accordingly. Developed road networks could also affect new urban development in tourist resort areas that once were remote rural regions with limited access (Petrov et al., 2009). The development of both networks (road and rail) is also accompanied by the use or even reshaping of the geomorphologic and topographic setting to create new infrastructure, tunnelling and bridges (Booth et al., 2011; Buchanan and Jones, 1980; Day, 1995; Pratesi et al., 2016; Watson et al., 2001). More recently, the development of underground tunnels for transport has created extensive subterranean networks in many large cities (Zalasiewicz et al., 2014).
1.5.4. 2.4 Subsistence
Together with deposits of stone tools, hearths and other evidence of controlled fire for cooking, warmth and protection from predators are likely the earliest evidence of human transformation of geophysical environments (Roebroeks and Villa, 2011; Smith, 2007; Wrangham, 2009). The earliest intentionally built fires were little more than controlled burns of woody and other flammable organic materials, but these evolved into hearths constructed of stones and earth, and ultimately into ovens, kilns and other larger scale fire containing structures. A typical hearth pit of the past formed a bowl-shaped soil discoloration less than 1 m in diameter and less than 0.5 m deep, with evidence of soil or rock exposure to high temperatures (Wandsnider, 1997), with differences in hearth-pit size and shape indicating different functions (Crombé et al., 2015; Pearson and Pearson, 1999). Human engineering of environments for food production begins in the late Pleistocene with hunter-gatherer modification of landscapes to concentrate and trap game and the use of fire to clear and enhance vegetation growth, followed by the rise of agriculture in the early Holocene, involving the digging of holes for planting, soil tillage and the construction of livestock pens and fencing, activities continuing to the present day (Ellis, 2015; Ellis et al., 2013; Smith, 2013; Smith and Zeder, 2013). Soil tillage leaves especially clear and widespread geomorphic signatures across landscapes in terms of anthropogenic soils and erosive deposits (Certini and Scalenghe, 2011; Ellis, 2011; Tarolli et al. 2019). The need to exploit steep lands for agriculture also introduced the construction of terraces (Chase et al., 2014; Tarolli et al., 2014; Vogel, 1987). Geomorphic features produced by livestock management include animal pens with soils altered by trampling and manure deposits, their surrounding fencing, sometimes constructed using rocks, earth and other durable materials, and the extension of fencing and animal paths across landscapes, often associated with water and shelter, including induced the deposition of stones and earth near fences, soil compaction and erosion from paths and disturbance and vegetation removal caused by overgrazing (Amy and Robertson, 2001; Mwendera
et al., 1997; Tarolli et al., 2013; Wu et al., 2017; Yong-Zhong et al., 2005; Zhang and Zhao, 2015).
1.5.5. 2.5 Mining
Although mining is as old as the manufacture of stone tools and leaves clear geomorphic signatures, it occupies a relatively small surface area worldwide (Tarolli and Sofia, 2016). Mining activity has been driven by a wide variety of objectives, including obtaining materials for making items such as tools, utensils, weapons, ornaments, decoration and currency (Timberlake, 2017). Mining of clay for bricks is also widespread and continues globally (Shakir and Mohammed, 2013). Further mining drivers have been the need for structures, and machinery, and obtaining resources for energy, electronics, nuclear fission (Hartman and Mutmanský, 2002; Herrington, 2013) and for low-carbon energy production (Vidal et al., 2013). As a consequence, various so-called “mining landscapes” have emerged all over the world since the 19th century. They are characterized by unique excavated, accumulated and planed landforms (Dávid, 2010) that bear the signature of the material sought. Such signatures can be broadly separated into two classes: surface and underground, although combinations of the two may occur in time and space (Mossa and James, 2013). The main characteristic is the persistence in time of the landform itself (Chen et al., 2015; Hooke and Martin-Duque, 2012; Xiang et al., 2018) and of the related effects on the environment (Kircher et al., 2003; Mossa and James, 2013; Rivas et al., 2006; Toy and Hadley, 1987).
1.5.6. 2.6 Water infrastructure
Although several forces beyond water management combine to shape societies, the availability of water strongly influenced the trajectory of past societies (Scarborough, 2017). As humans began to settle as farmers during the Neolithic, water wells and water infrastructures began to rise (Angelakis and Andreas, 2012; Kollyropoulos et al., 2017; Tegel et al., 2012). These features leave a distinctive topographic signature that can still be identified on the landscape today, thousands of years later (Yevjevich, 1992). An example of this would be Qanat, which are gently sloping underground channels designed to transport water from an aquifer or water well to the surface for irrigation and drinking (Wessels, 2014), originating in the first century and distributed mainly in the Iranian plateau and east of Xinjiang Province in China (Goes et al., 2017; Harandi and de Vries, 2014; Luo et al., 2014). Another example is the famous hydraulic infrastructure of Pont du Gard in southern France (Dumas, 2011; Vrancic, 2010). Ditches provide further water infrastructure for reclamation purposes, irrigation and drainage alongside roadways or fields (Terry and Hughes, 1978). As well, canals provide water conveyance, navigation and water storage (Swamee and Chahar, 2015). Along water infrastructures, especially in floodplains, humans built embankments, levees and scarps. These infrastructures not only offer protection from floods, but they also change the flood frequency and create disconnectivity between the river landscape and its floodplain (Chin et al., 2013; Gregory, 2006; Overeem et al., 2013; Thoms et al., 2005).
Another example of water control measures is provided by dams and reservoirs, which have increased dramatically in number and scale globally since the 1950s (Chao, 1995), to the point that water impounded in artificial reservoirs since the 1950s is by far the most significant anthropogenic hydrological change in terms of water volume (Vörösmarty et al., 2003, 2004). These structures are built for irrigation purposes, water for human consumption, agricultural use, power generation, land drainage and reclamation, flood mitigation and recreational use (Castelletti et al., 2008; FAO, 2001; Gordon and Meentemeyer, 2006; Hall and Shelby, 2000; Le et al., 2007). These
functions are, however, accompanied by environmental changes, including subsequent impacts on lowland rivers and coastal systems, climate-changing greenhouse gases emissions, changes in the temperature regime, sedimentation, water pollution and destruction of ecosystems due to the reservoir effect on downstream environmental flows and sediment supply (Dević, 2015). Artificial wetlands have also become ubiquitous in recent decades, and are a distinctive form of water management system created for the purpose of treating municipal or industrial wastewater, greywater or stormwater, to act as a biofilter and remove pollutants from the water and for land reclamation after mining, refineries or other ecological disturbances (ElZein et al., 2016; Vymazal and Kröpfelová, 2008; Zhang et al., 2009). Some of the most dramatic anthropogenic transformations of Earth's surface occur at the interface between terrestrial and aquatic environments, which include massive and elaborate mechanisms for displacing and managing water. Recent advances in engineering technology have allowed for extensive land reclamation and the creation of artificial islands to provide new spaces for development and to achieve political and strategic objectives (Goudie and Viles, 2016; Martín-Antón et al., 2016).
1.5.7. 2.7 Refuse disposal
Middens are among the first and most prominent examples of physical remnants of resource exploitation activities in the archaeological record, with potential consequences for a range of related physical and chemical characteristics, for example increased soil alkalinity, and in particular increases in levels of nitrogen, calcium, potassium and manganese (Cook-Patton et al., 2014). Middens offer an important archive of information about human dispersal and group diversification because they can be created either at the household level or the community level (Trebsche, 2009). They preserve records that are particularly valuable for the development of interdisciplinary approaches in investigating human–environment interaction, social relations and the role of resource exploitation in the developmental trajectory of human groups (Álvarez et al., 2011; Rick et al., 2005). They are also suitable for radiocarbon dating (Brady, 2016). Another widespread remnant of past resource exploitation survives in the form of tells, artificial features (mounds) formed from the accumulation of refuse over millennia of settlement activities (Portal, 2017). Their size and shape carry the fingerprint of diverse cultures and, in most cases, they are representative of the earliest settlement systems, beginning in the Neolithic period (Menze et al., 2006). In modern times, middens and tells evolved as landfills used for waste management and processing waste material in the most cost-efficient way (Stirling, 2015). The physical structure of landfills embodies diverse input characteristics, such as aspects of terrain, existing land use, aesthetic value, government regulations and public opinion about the sites themselves (Sharma, 2010).
1.5.8. 2.8 Warfare
Landform features have also been created for warfare or defence. These features include not only artificial structures, such as fortifications (De Matos-Machado et al., 2015; Ilyés, 2010; Moss and Erlandson, 1992), trenches (Baer and Ashworth, 1981; Houx, 2001; Power, 2009), improvised explosive device (IED) command wires (McDonald and Schumer, 2016), bunkers and missile silos, among others, but also existing underground terrain (Eastler, 2004) or rock defences (Moss and Erlandson, 1992). The most famous example of trench warfare is the Western Front World War I, which has become the classic example of stalemate, attrition and futility in modern conflict (Baer and Ashworth, 1981). However, this class of features also
includes direct geomorphological evidence, such as bomb and mine craters (Hupy and Schaetzl, 2006; Kiernan, 2015), uranium mining (Blustain, 2016) or landscape modification due to military structures (Yatsko, 2016). Clearly, conflicts leave a significant topographic signature on the landscapes, and they also result in long-term landscape modifications (Bothe, 2007), with impacts on remoteness and naturalness, or on physical phenomena such as geodiversity (geology, landforms, soils and the natural processes that give rise to them) (Kiernan, 2015).
1.6. III The contribution of remote sensing
Remote sensing is increasingly used for the analysis of landform changes, both contemporary and historical. The concept of anthropogenic landscapes as sociocultural palimpsests composed of the overlapping sociocultural fingerprints of multiple societies provides a theoretical framework through which this growing body of remotely sensed data can be used to detect and interpret anthropogenic geomorphic features, landforms and landscapes. The necessary first stage of this interpretation is the identification and labelling of these features. In the last decade, a range of new remote sensing techniques has led to a dramatic increase in terrain information, providing new opportunities for a better understanding of Earth surface processes based on geomorphic signatures (Tarolli, 2014). These techniques have spurred renewed interest in the role of social-ecological systems in shaping Earth's surface (Johnson and Ouimet, 2018), ranging from studies of "archaeological topography" among social sciences (Canuto et al., 2018; Evans et al., 2013; Opitz and Cowley, 2013) to the study of "geomorphometry" among geoscientists (Pike, 2000; Sofia et al., 2016b). Technologies such as LiDAR (see Tarolli, 2014, for a review), satellite (Purinton and Bookhagen, 2017) and structure from motion –
SfM – (see Eltner et al., 2015; Fonstad et al., 2013; James and Robson, 2012, for reviews) have opened avenues for the analysis of anthropogenic signatures and processes (Tarolli, 2014). In this context, one of the actual challenges is the ability to model the anthropogenic morphologies, quantify them and analyse the links between anthropogenic elements and geomorphic processes. In the following sections, a few examples are provided on how remote sensing data can be used to extract and analyse anthropogenic features and quantify anthropogenic changes on the surface.
1.6.1. 3.1 Extraction from imagery
Despite the limitation due to shadowing, angle of incidence or lack of topographic information under vegetation cover (Mostafa and Abdelhafiz, 2017; Quartulli and Olaizola, 2013; Sowmya and Trinder, 2000), archaeologists have made use of radar and satellite images to reveal differences in texture, roughness, moisture content, topography and geometry of features and surfaces related to human activities, for example (Evans et al., 2007; Fowler, 2002; Holcomb, 2001; Holcomb and Shingiray, 2006; Moore et al., 2006; Ricketson et al., 2003). More recently, images from satellites have been used not only in relation to anthropogenic features in the context of urban studies (see Ghanea et al., 2016, for a review), for cadastral boundary extraction (Crommelinck et al., 2016; Wassie et al., 2017) and oil spill detection (Brekke and Solberg, 2005), but also to identify target features in ongoing and post-humanitarian crisis scenarios (Witharana, 2012; Witharana and Civo, 2012). In analyses of this type, image analysis techniques, such as wavelets and fusion algorithms, or texture analyses, can enhance and localize patterns related to human activities, and they can be used to extract features of interest, such as not only buildings, but also shelters and war/flood/earthquake damaged structures. To illustrate this point we
show in Figure 3 a Pleiades satellite image. The study area is spatially stratified in environmentally similar land units (Figure 3(d)) using image analysis techniques (Figures 3(b) and (c)) and, thus, it is possible to identify those areas that are most likely to present anthropogenic landscapes (Figure 3(e)). Feature extraction from satellite images is, however, limited by shadows (Mostafa and Abdelhafiz, 2017) and other technical issues, such as angle of incidence (Quartulli and Olaizola, 2013; Sowmya and Trinder, 2000). Satellite images, furthermore, cannot be used to extract ground features under vegetation cover.
1.6.2. 3.2 Extraction from three-dimensional surfaces
A further step in feature extraction is allowed by the availability of three-dimensional (3D) models (Digital Terrain Models – DEMs). When DEMs are available, the most straightforward approach to anthropogenic feature analysis is visualization, namely the use of hillshade or shaded-relief maps (Figure 4(a)), for example (Bennett et al., 2012; Chase et al., 2014; Deforce et al., 2013; Doneus et al., 2008; Golden et al., 2016; Harmon et al., 2006; Johnson and Ouimet, 2016, 2018; Menze et al., 2006; Risbøl et al., 2013; Tapete et al., 2017).
This approach simulates lights and shadows to enhance the presence of features captured by the input dataset. Slightly more advanced techniques, based on compound approaches, have been also developed, such as the sky view factor (Figure 4(b)) (Bennett et al., 2012; Devereux et al., 2008; Kennelly, 2008; Štular et al., 2012) or advanced analysis of hillshades (O’Neal, 2012). The advanced use of topographic parameters directly derived from the DEMs allows not only for the visualization, but also for the classification of anthropogenic features. The most direct and straightforward approach is offered by the so-called “detrending” techniques. Data are filtered using “low pass” filters, resulting in a smoothed surface to subtract from a LiDAR DEM (Figure 4(c)), for example (Cazorzi et al., 2013; Hesse, 2010; Howey et al., 2016; Luscombe et al., 2015; Schindling and Gibbs, 2014; Sofia et al., 2014c). As the values in the detrended data represent the height difference from a smoothed surface, peak values in either the positive or negative domain (depending on the approach) highlight the microtopographic element in the landscape, such as drainage features or pits, or walls. Further useful topographic parameters can be used, such as slope (Figure 4(d)), (e.g. McCoy et al., 2011; Riley, 2012), slope and also exposure under a water surface (Cappucci et al., 2017) and curvature (Figure

Figure 3 consists of five panels labeled (a) through (e). Panel (a) is a grayscale satellite image showing a river and surrounding urban areas. Panel (b) is a color-coded map showing the local range of values (max-min) within a 11x11 neighborhood. Panel (c) is a color-coded map showing the local standard deviation of values within a 11x11 neighborhood. Panel (d) is a color-coded map showing the result of an iterative optimization clustering procedure. Panel (e) is a black and white map showing extracted buildings. A scale bar at the bottom left indicates 0 to 250 m. A legend on the right side of panel (e) shows the unsupervised classification classes (1-6) and possible buildings (black and white).
Figure 3. Example of satellite image, derived texture parameters and classification: (a) Pleiades 0.5 m satellite image; (b) local range of values (max–min); (c) local standard deviation of values within a neighbourhood (Haralick, 1982); (d) iterative optimization clustering procedure implemented by the commercial software ArcGis® (Ball and Hall, 1965; Richards, 2013); (e) extracted buildings.
4(e)), (Drăguț and Blaschke, 2006; Sofia et al., 2014a; Tarolli et al., 2014). Recent literature has highlighted how image processing local filters can also be applied to a DEM to detect high-frequency variations (e.g. Laplacian – Figure 4(f), Sobel’s filters, SLLAC – Slope Local Length of Correlation) (Sofia et al., 2014b, 2016; Stal et al., 2010; Štular et al., 2012). These enhancing techniques can be the basis to segment and detect anthropogenic patterns and features using GEOBIA (GEOgraphic-Object-Based Image Analysis) (see Blaschke et al., 2014; Cerrillo-Cuenca, 2017; Diaz-Varela et al., 2014; Eckert et al., 2017; Hay and Castilla, 2008) or automatic thresholding (e.g. Figure 5).

Figure 4. WWI trenches and terraces: (a) hillshade; (b) sky-view factor; (c) detrended Digital Terrain Model (DEM); (d) slope; (e) curvature; (f) Laplacian filtered DEM.
1.6.3. 3.3 Quantitative assessment of features
Extractions carried out with thresholding or object-oriented approaches, although able to detect the two-dimensional (2D) location of anthropogenic elements, are not able to quantify whether or not they are continuous features in the landscape. Nevertheless, they can offer the basis for further evaluations of lengths, densities and volumes, for example (Sofia et al., 2014c; Sofia and Tarolli, 2017; Sofia et al. 2019), or the extent of 2D features. In addition, high-resolution DEMs can offer the basis to measure the shape and sizes of anthropogenic elements directly in the digital realm (Johnson and Ouimet, 2016; Sofia et al., 2016a). A further step in anthropogenic features characterization is offered by change detection techniques or time-series data analysis, which
has gained significant attention due to its capability of providing volumetric and extent measures in time (see Qin et al., 2016, for a review). These techniques rely on the availability of multitemporal datasets, real or simulated, to be used to compare anthropogenic features in time (Haas et al., 2016; Prosdociimi et al., 2015; Wróżyński et al., 2017; Xiang et al., 2018; Yucel and Turan, 2016). Figure 6 shows an example of geomorphic change detection evaluated considering the Wheaton et al. (2010) approach. For this area, multitemporal orthophotos (Figures 6(a) and (d)) and LiDAR DEMs (Figures 6(b) and (e)) are freely available (Institut Cartogràfic De Catalunya (ICC), 2005, 2008) for the years 2005 and 2008. From these maps, it is possible to compute a volumetric difference (Figure 6(c)), taking into account the errors that might be present in the DEMs themselves (see Lane et al., 2003, for specification on the method).

Figure 5 consists of six panels (a-f) arranged in a 2x3 grid. Panels (a) and (d) are satellite images of tobacco and corn fields, respectively, with a 100 m scale bar. Panels (b) and (e) show the Detrended Digital Terrain Model (REA) for the same areas, with a color scale from High (0.5) to Low (-0.5). Panels (c) and (f) show the extracted canals from the REA data, with a legend indicating 'Background' (black) and 'Extracted canals' (white). A north arrow is located in the top right corner of panel (c).
Figure 5. Agricultural practices in northeastern Italy ((a) tobacco; (d) corn). Detrended Digital Terrain Model (REA, Cazorzi et al., 2013) (b), (e) and ditches derived automatically by applying a statistical threshold (standard deviation of Relative Elevation Attribute (REA)) (c), (f).
1.6.4. 3.4 Limits and merits
Improvements in spectral, spatial and temporal resolution are revealing more and more rich and detailed information to decipher landscape palimpsests. The synoptic view offered by compound analyses integrating satellite, airborne and photogrammetry enable integrated landscape investigations across scales in terms of resolution and coverage, from small features to entire regions, and comparisons across and within regions, and long time series allow
monitoring and diachronic analysis of changes in landforms. Recent availability of wide-area, high-resolution LiDAR is revolutionizing these efforts, owing to its unique capability to penetrate vegetation canopies and identify earthwork features at high spatial resolutions even under dense vegetation cover.
Challenges remain for using these data to detect anthropogenic features and their distributions across landscapes and regions. A better understanding of the representation of anthropogenic features within the data itself will be critical, combined with improvements in processing techniques that make analyses of vast quantities of data more manageable. Moreover, each study presents its own challenges. For example, traces of ancient ruins and infrastructures might lie below relatively modern roads, buildings and agricultural fields, or ancient structures might be made of the same material that underlies a whole study area. A further impediment to reliable feature identification is that long-term exposure to natural environmental processes, such as erosion and sediment deposition, can make anthropogenic features extremely difficult to distinguish from natural ones (Liu et al., 2017). A clear example of this is the effect of natural weathering processes on landfills or tells: ancient mounds nowadays might resemble natural hillslopes, and modern landfills will, over time, tend to smooth out to the same level as the surrounding land surface.

Figure 6 displays a comparison of LiDAR Digital Terrain Model (DEM) data and derived change of detection for the years 2005 and 2008. The figure is organized into five panels: (a) 2005 orthophoto, (b) 2005 LiDAR DEM, (c) derived change of detection in 2005, (d) 2008 orthophoto, (e) 2008 LiDAR DEM, and (f) derived change of detection in 2008. A scale bar indicates 0 to 200 m. A legend for 'Difference (m)' is provided, showing color-coded ranges from red (< -22.30) to blue (> 22.30).
| Difference (m) | Color |
|---|---|
| < -22.30 | Red |
| -22.30 to -19.80 | Dark Red |
| -19.80 to -17.30 | Orange |
| -17.30 to -14.80 | Light Orange |
| -14.80 to -12.40 | Yellow |
| -12.40 to -9.90 | Light Green |
| -9.90 to -7.40 | Green |
| -7.40 to -4.90 | Light Blue |
| -4.90 to -2.50 | Blue |
| -2.50 to 0.00 | Dark Blue |
| 0.00 to 2.50 | Light Green |
| 2.50 to 5.00 | Green |
| 5.00 to 7.50 | Light Blue |
| 7.40 to 9.90 | Blue |
| 9.90 to 12.40 | Dark Blue |
| 12.40 to 14.90 | Light Green |
| 14.90 to 17.40 | Green |
| 17.30 to 19.80 | Light Orange |
| 19.80 to 22.30 | Orange |
| > 22.30 | Red |
Figure 6. Example of change of detection from LiDAR Digital Terrain Model (DEM). Orthophotos for the year 2005 (a) and 2008 (c), LiDAR DEM in 2005 (b) and 2008 (e) and derived change of detection in m (c).
Developments in computer science and statistics offer a wide range of powerful tools to
augment the detection and interpretation of anthropogenic features, and potentially the sociocultural fingerprints of entire societies across large regions. These tools include advanced systems for geographic information systems (GISs), 3D modelling, predictive modelling, visualization, simulations and machine learning (e.g. Guyot et al., 2018). Ironically, however, there remains no standard ontological framework within which to classify and understand anthropogenic landscapes and the features within them, despite their coverage of the vast majority of Earth's terrestrial surface (Ellis et al., 2013). By developing standardized frameworks for feature and fingerprint detection and interpretation, and ultimately by automating these, rapidly expanding Earth coverage by high-resolution 3D remote sensing can be utilized to examine Earth's global geomorphic transformation by human societies, together with a wide range of other useful societal applications (Tarolli et al., 2017).
1.7. IV Decoding palimpsests: From features to fingerprints
Few existing landforms are formed solely through natural or anthropogenic geomorphic processes operating within a single discrete time period. By and large, landforms tend to incorporate multiple interwoven and entangled layers of materials, both natural and anthropogenic, generated by different processes at different times, written and rewritten repeatedly by various combinations of natural and anthropogenic processes: landscapes are palimpsests (Johnson and Quimet, 2018). In any given region, therefore, complex overlapping topographic signatures can be observed. Some landform features might be very young because they are currently being shaped, but they may also bear the signature of historical modifications under specific social conditions or natural geomorphic processes that are no longer present in that region. Some other features may be entirely "relictual" because they were formed at some point in the past when social conditions, processes or environments were substantially different or operated at a different magnitude to those of the present time.
While remote sensing together with algorithmic methods enable the detection and identification of anthropogenic and other features, researchers are rarely able to observe or interpret these features across the scales of time or space in which the societies that formed them operated, although reconstructions of these long-term changes have long been a major focus of archaeological research (e.g. Butzer, 1982b; Dincauze, 2000). This remains the central challenge of anthropogenic geomorphology: to interpret anthropogenic features as diagnostic fingerprints of the societies and social processes
that formed them, both locally and across the entirety of the regions where these societies were located. To meet this challenge requires an integrated social-geophysical approach combining the theories, frameworks and methods of geomorphology, archaeology and ecology.
1.7.1. 4.1 General principles of sociocultural landscape formation
The first principle of anthropogenic geomorphology is that the sociocultural processes that form anthropogenic landforms are fundamentally different to natural processes like erosion or deposition. Even though natural and anthropogenic geomorphic features may share real similarities in form and even function (Figure 7), the processes forming them are fundamentally different. Unlike the forces of gravity, hydrology and geophysics, which have not changed since the formation of this planet, the forces of landscape change generated by human societies can and have changed dramatically over time, together with societies themselves (Figures 1 and 8).
The first step towards a process-based understanding of anthropogenic geomorphology is therefore the development of a timeline of known sociocultural changes across the landscape of interest, with the aim of understanding the historical layering of anthropogenic features, together with a timeline of major natural environmental changes and events, including major changes in precipitation, floods, tectonic and volcanic activity that have interacted with anthropogenic processes in forming the landscape under observation. This basic timeline should include a catalogue of the types of anthropogenic features created by different societies, including any geometric, symbolic or other cultural identifiers that can assist in reconstructing the layers of anthropogenic features produced across landscapes during specific periods of time. By combining social-geomorphologic timelines with detailed spatial data on landform structure, the spatial patterning of anthropogenic features and landforms may be understood in terms of the sociocultural and natural processes that have formed them.

Figure 7. Example of similarity between anthropogenic and natural features: (a) local road network; (b) flowlines in Pennsylvania (USA).
While the full range of sociocultural patterns, processes and dynamics observed across human societies (Figure 1) is far larger than those occurring within any particular landscape, Figure 1 illustrates that anthropogenic geomorphic practices can be completely different in different societies, and that larger, more complex societies tend to engage in a larger number of different types of anthropogenic geomorphic practices and that the size of geomorphic features is also associated with societal scales (larger scale societies are generally capable of producing larger scale features). As the features of earlier societies can be added to by societies that come later, the total number of different types of anthropogenic features should be expected generally to increase over time, although the removal, destruction and overwriting of earlier features by later societies can erase or reduce the accumulation of
landform complexity, as can erosion and other natural processes.
A second principle of anthropogenic features and landforms is that their constituent materials may differ dramatically from those found naturally within a specific landscape or region (Zalasiewicz et al., 2017). The presence and composition of these materials, from stone, wood and other materials distinct from local materials and transported from other areas, to bricks, concrete, steel and other materials produced exclusively by human societies, and the presence and spatial organization of anthropogenic materials can be diagnostic of anthropogenic geomorphology – and detectable using remote sensing. The use of anthropogenic materials also enables the construction of anthropogenic features without natural analogues, from buildings to highway overpasses. As with feature types and sizes, the number of different types of materials utilized in feature construction also tends to increase with societal scale, with larger scale societies generally deploying a greater number of novel materials across anthropogenic landscapes.

Figure 8. Different patterns (a), (d) highlight different cultural settings. Roman centuriation of an area near Padua (Italy (b)) and Valencia (Spain (c)), and modern residential areas in Milton Keynes (UK (e)) and Boulder (USA (f)).
A third principle of anthropogenic geomorphology is that within the regions influenced by a given society, the sociocultural functions that create anthropogenic features are not homogeneous, but rather differ across space in relation to both social and natural patterns. For example, within agrarian societies, there are often distinct clusters of housing, connected
by paths and roads, with agricultural fields and irrigation systems in the flatter lands in between, with less used areas on hillslopes. Larger scale urban societies show similar social patterns, but these may operate at much larger scales, and even globally at the present time. These patterns are aligned with the broader model of human sociocultural niche construction (Ellis, 2015), as modified and illustrated by the state equation: Anthropogenic landforms = .
This model describes the anthropogenic landforms produced in a given location in terms of its general biogeophysical conditions (biome, e.g. desert, savannah, rainforest), the specific terrain (terrain, e.g. floodplain, hillslope, mountain top), the societies that have operated at the location, the social position within the societies' operating spaces (social centrality, i.e. the travel distance from social centres, such as villages, towns and cities, the opposite of remoteness) and the amount of time over which the anthropogenic processes have operated. Based on this simple conceptual model, the types of features present within a specific location are contextualized both within the social space of the societies operating across a given site or region, with anthropogenic features produced by habitation expected to occur at high frequencies in areas of high social centrality, with transport features interconnecting these, while subsistence, mining, refuse, water infrastructure and other anthropogenic features are distributed in relation to suitable terrain and distance from social centres. In smaller scale societies, these functions and features tend to be tightly clustered in space, sometimes with the exception of symbolic and mining features, while larger scale societies tend to distribute these functions and features more widely, even globally. By combining these general principles of sociocultural landscape formation in relation to underlying biogeophysical conditions, the spatial patterning of anthropogenic features and landforms can be understood as the sociocultural fingerprints of the societies that have constructed them.
1.7.2. 4.2 From features to fingerprints
Although anthropogenic features can increasingly be detected through remote sensing and distinguished from natural features as a function
of their shape and material composition, a separate process of anthropogenic landscape interpretation is needed to understand their sociocultural and functional identity and their relation to the sociocultural processes that formed them – the basis both for feature classification and labelling and for the interpretation of features across landscapes and regions to identify the sociocultural fingerprints of societies. Automated feature classification is now increasingly capable of identifying classes of relatively homogeneous 3D entities (Figure 3(d)), but without further understanding of their sociocultural functions, such as habitation, symbolic culture or water infrastructure, these classifications remain purely geometric, and feature shape can at times be an unreliable indicator of function. Nevertheless, there is growing technological capacity for defining feature templates describing the geometry of specific anthropogenic feature classes, thereby enabling automated feature function identification and labelling using template matching (Schneider et al., 2015), object-oriented techniques (Blaschke et al., 2014) and/or machine learning approaches (Valentine and Kalnins, 2016). There is great promise in using these and other methods, including supervised feature classification leveraging spectral and geometric signatures developed by archaeologists and physical geographers with knowledge of the social-geomorphic timeline of a given landscape and its associated anthropogenic features, to train automated procedures to identify specific functional forms of anthropogenic features, such as buildings (Figure 3(e)). Caution is necessary, however, as natural landforms can have similar shapes to anthropogenic features: for example, a hearth-pit, a bomb crater and a karstic sinkhole might all have very similar geometry.
The confusion of natural and anthropogenic patterns across landscapes can present similar challenges to the automated analysis of sociocultural fingerprints. A wide variety of natural spatial features have been shown to be statistically self-similar over many scales, suggesting that fractal patterns are a signature of natural geomorphic patterns (Goodchild and Mark, 1987; Rodriguez-Iturbe and Rinaldo, 1997; Tarboton et al., 1988). For example, road networks can assume dendritic forms very similar to those of river networks (Figure 7), and agricultural terraces can resemble river terraces.
Yet, built-up environments may also possess similar structures at several different scales (Batty, 2008; Batty and Longley, 1994; Frankhauser, 2008; Thomas et al., 2008). Road networks, for example, are inherently fractal (Liu et al., 2014). Nevertheless, patterns of statistical self-similarity may yet prove capable of identifying differences between natural geomorphology and sociocultural fingerprints by developing rule-based systems for the classification of spatial-scale dependence of large-scale geomorphic patterns (Jiang and Brandt, 2016). The automated detection of larger scale patterns by aggregate assessment of feature composition and configuration across space through deep learning algorithms offers a clear way forward, analogous to progress with automated fingerprint detection in forensics (Schmidhuber, 2015).
1.7.3. 4.3 A way forward
The future of anthropogenic geomorphology will depend on a level of integration between theory and methodology that goes far beyond what we have presented here. Nevertheless, the way forward is clear, requiring a focus on the broader sociocultural, spatial and temporal contexts of anthropogenic landscape formation, rather than the mere presence or absence of specific anthropogenic features. Analysing the spatial structuring of features across landscapes in relation to the sociocultural and material systems that have shaped them can be essential to determine whether features have originated naturally, have anthropogenic origins or have emerged through the interplay of social and
natural processes. One example of this broader focus on sociocultural fingerprints is the differential patterning of urban landscapes around the world (Figure 8). Centuriation (Figure 8(a)) is typical of regions historically conquered by Romans (such as Italy (Figure 8(b)) and Spain (Figure 8(c))). In such cases, the city/agriculture follows a grid traced by extending the ancient Roman roads (Cardo Maximus and the Decumanus Maximus of the ancient cities) into the surrounding agricultural land. Parallel secondary roads were then traced on both sides of the initial axes, dividing the territory into square areas. Residential areas within modern cities present a different structure (Figure 8(d)), where similar patterns are produced by street geometry adapted to exclude traffic at the local street level and facilitate flow at the collector and arterial levels. In such systems, major internal roads run between communities, rather than through them, and they create grid squares where the road network uses cul-de-sac streets complemented by (for example) bike and footpaths that connect the entire sector and beyond.
Other examples of sociocultural fingerprints include the spatial patterning of waste disposal sites from informal middens to the regionally planned systems of larger scale societies (Sharma, 2010), the integration of green spaces into cities, the development of “agro-urban landscapes” integrating traditional agrarian landscape patterns within contemporary urban/industrial developments (Cavallo et al., 2016; Evans, 2016; Seto and Fragkias, 2005) and the spread of road networks (Corcoran et al., 2013; Strano et al., 2012). Even more detailed understanding of the functional roles of anthropogenic geomorphology can even enable the detection of specific cultivation practices. For example, different patterns of ditch networks (Figures 5(c) and (f)) support different cultivation practices (e.g. tobacco (Figure 5(a) and corn (Figure 5(d))), and identifying these patterns requires a deeper understanding of the sociocultural practices of the societies that formed and/ or operated them. Such an understanding, formed through careful reconstructions of the material cultures of societies across sites, is at the core of much archaeological research (Butzer, 1982b; David and Thomas, 2016). As the spatial and social scale of societies has increased, so have their capacities to reshape landforms locally, regionally and globally. Evidence already supports the hypothesis that anthropogenic transformations of land surface processes now move more of Earth's surface than any pre-existing natural process

Figure 9 displays local-scale percentage of anthropogenic geomorphology, compared to anthropogenic biomes. The figure includes 14 panels (a-n) showing maps of different regions, a world map with location markers, and a legend.
Legend:
- Urban
- Dense settlements
- Rice villages
- Irrigated villages
- Cropped pastoral villages
- Pastoral villages
- Rainfed villages
- Rainfed mosaic villages
- Residential irrigated cropland
- Residential rainfed mosaic
- Populated irrigated cropland
- Populated rainfed cropland
- Remote cropland
- Residential rangeland
- Populated rangeland
- Remote rangeland
- Populated forest
- Remote forest
- Wild forest
- Sparse trees
- Barren
Anthropogenic geomorphology (%km2)
Color scale for anthropogenic geomorphology percentage:
- <10%
- 10-20%
- 20-30%
- 30-40%
- 40-50%
- 50-60%
- 60-70%
- 70-80%
- >80%
Figure 9. Local-scale percentage of anthropogenic geomorphology, as compared to anthropogenic biomes (Ellis and Ramankutty, 2008). Dataset credit: (a) Minnesota Geospatial Information Office (MnTOPO®); (b) Halifax Regional Municipality – Canada; (d) Autonomous Province of Trento (Provincia Autonoma di Trento, Italy); (e) Department of Environment, Food and Rural Affairs, UK; (f) Sturelsen for Dataforsyning og Effektivisering; (g) National Land Survey Finland; (h) Sample data by the Lantmäteriet (Sweden); (c), (i), (j), (k), (l) data from CNES© Distribution Airbus DS; (m) TERN© AusCover; (n) OpenTopography Facility with support from the National Science Foundation under NSF Award Numbers 0930731 & 0930643 FAPESP grant 2009/17675-5.
(Wilkinson and McElroy, 2007; Zalasiewicz et al., 2017). Yet, these broad estimates of anthropogenic global change demand to be assessed with the greater precision and spatial context made possible by high-resolution reconstructions of anthropogenic geomorphic changes at local and regional scales. These measurement capabilities, for example the computation of volumetric changes caused by anthropogenic reshaping of landforms (e.g. Figure 6(c)), are only increasing as a result of advances in sensor systems, computational technology and large-scale data sharing, making the prospect of quantifying processes of anthropogenic geomorphic change globally over the long term a real possibility (Tarolli et al., 2017). The prospect of global assessment of anthropogenic geomorphology is illustrated in Figure 9, examining a suite of sites around the world in which anthropogenic geomorphology has been mapped using satellite and LiDAR data available to the public as free open-data or as samples. Given that different uses of land are expected to shape different landforms differently (e.g. Sofia et al., 2014b), stratifying these observations in relation to global patterns of land use, such as the anthropogenic biomes (Figure 9), may offer a general sampling framework for the global mapping and quantification of anthropogenic geomorphic change.
Anthropogenic geomorphology forms just one of many layers of the evolving geomorphic palimpsests that now cover most of Earth's dynamic terrestrial surface. Through a systematic assessment of anthropogenic geomorphology around the world and across time periods, it may yet be possible to develop a more general framework, perhaps even a predictive theory, on the geomorphological niche of societies, uniting the analysis of distinct geomorphic features to assess the evolving sociocultural fingerprints of societal change.
1.8. V Concluding remarks
Human societies, across millennia, have reshaped Earth's geomorphology, producing distinctive anthropogenic landforms that now cover the vast extent of Earth's surface. These anthropogenic patterns directly and indirectly alter Earth surface processes while reflecting the sociocultural conditions of the societies that produced them. As a result, both archaeological and contemporary assessments of Earth's surface morphology reveal a wealth of diverse anthropogenic geomorphic features that can serve as diagnostic signatures or
"sociocultural fingerprints" of the societies that formed them, including their interaction and communication with other societies. This paper offers a general framework aimed at integrating geophysical and archaeological approaches to observe, identify and interpret anthropogenic geomorphic features, based on their societal structure and functioning. By introducing the concept of "sociocultural fingerprints", we connect the novel Earth system processes introduced by the emergence and evolution of human societies with their continuous shaping and reshaping of Earth's geomorphology from the deep past into the foreseeable future. Building on this concept, we underline the opportunity to recognize the geomorphic signatures of sociocultural fingerprints across Earth's land surface using high-resolution remote sensing approaches combined with an empirical and theoretical framework that integrates the natural and sociocultural forces that have and will shape the landscapes of the Anthropocene. By engaging these frameworks together, the long-term dynamics of anthropogenic landscapes can be more effectively investigated and understood, towards more sustainable management of the Earth system, including its hydrosphere and lithosphere, into the deep future.
1.9. Declaration of conflicting interests
The author(s) declared no potential conflicts of interest with respect to the research, authorship and/or publication of this article.
1.10. Funding
The author(s) disclosed receipt of the following financial support for the research, authorship and/or publication of this article: This work has been supported by the University of Padova grant 60A08-5455/15 "the analysis of the topographic signature of anthropogenic processes", by the European Research Council (ERC) under the European Union's Horizon 2020 research and innovation programme (grant agreement No 639828), and by the Fondazione Cassa di Risparmio di Padova e Rovigo
(CARIPARO) Visiting Professorship at the Department of Land, Environment, Agriculture and Forestry (TESAF) of the University of Padova.
1.11. ORCID iD
Paolo Tarolli  https://orcid.org/0000-0003-0043-5226
Damian Evans  https://orcid.org/0000-0003-0320-4319
Erle C Ellis  https://orcid.org/0000-0002-2006-3362
1.12. References
- Álvarez M, Godino IB, Balbo A, et al. (2011) Shell middens as archives of past environments, human dispersal and specialized resource management. Quaternary International 239(1): 1–7.
- Amy J and Robertson AI (2001) Relationships between livestock management and the ecological condition of riparian habitats along an Australian floodplain river. Journal of Applied Ecology 38(1): 63–75.
- Angelakis AN and Andreas N (2012) Evolution of Water Supply throughout the Millennia. London: IWA Publishing.
- Antrop M (2004) Landscape change and the urbanization process in Europe. Landscape and Urban Planning 67(1–4): 9–26.
- Azara P (2015) Neolithic village of the Syro-Mesopotamian city. Aula Orientalis 33(1): 197–199.
- Baer GW and Ashworth T (1981) Trench warfare, 1914–1918: The live and live system. Contemporary Sociology 10(5): 664.
- Bailey G (2007). Time perspectives, palimpsests and the archaeology of time. Journal of Anthropological Archaeology 26(2): 198–223.
- Ball GH and Hall DJ (1965) ISODATA, a Novel Method of Data Analysis and Pattern Classification. Menlo Park, CA: Stanford Research Inst.
- Batty M (2008) The size, scale, and shape of cities. American Association for the Advancement of Science 319(5864): 769–771.
- Batty M and Longley P (1994) Fractal Cities: A Geometry of Form and Function. London, UK: Academic Press.
- Beck J and Chrisomalis S (2008) Landscape archaeology, paganism, and the interpretation of megaliths. Pomegranate 10(2): 142–162.
- Bell MGH and Iida Y (1997) Transportation Network Analysis. Chichester, UK: Wiley and Sons Ltd.
- Belmonte JA (2014) On the orientation of early bronze age tombs in ancient Magan. Mediterranean Archaeology and Archaeometry 14(3): 233–246.
- Bennett R, Welham K, Hill RA, et al. (2012) A comparison of visualization techniques for models created from airborne laser scanned data. Archaeological Prospection 19(1): 41–48.
- Beranek WJ (1988) Stable - Unstable? Structural Consolidation of Ancient Buildings. Leuven, Belgium: Leuven University Press, 29–43.
- Blanton P and Marcus WA (2009) Railroads, roads and lateral disconnection in the river landscapes of the continental United States. Geomorphology 112(3–4): 212–227.
- Blanton P and Marcus WA (2013) Transportation infrastructure, river confinement, and impacts on floodplain and channel habitat, Yakima and Chehalis rivers, Washington, U.S.A. Geomorphology 189: 55–65.
- Blaschke T, Hay GJ, Kelly M, et al. (2014) Geographic object-based image analysis - Towards a new paradigm. ISPRS Journal of Photogrammetry and Remote Sensing 87(100): 180–191.
- Blustain JS (2016) Military Geosciences and Desert Warfare. New York: Springer, 107–121.
- Booth P, Champion T, Garwood P, et al. (2011) Tracks Through Time: The Archaeology of the Channel Tunnel Rail Link. Oxford: Oxford Archaeology.
- Bothe M (2007) Military activities and the protection of the environment. Environmental Policy & Law 37(2/3): 232–238.
- Boyce GA, Marshall DJ and Wilson J (2015) Concrete connections? Articulation, homology and the political geography of boundary walls. Area 47(3): 289–295.
- Brady LM (2016) Contemporary indigenous relationships to archaeological features: Agency, affect, and the social significance of rock art. Heritage & Society 9(1): 3–24.
- Brekke C and Solberg AHS (2005) Oil spill detection by satellite remote sensing. Remote Sensing of Environment 95(1): 1–13.
- Briones ML (2006) The geoglyphs of the north Chilean desert: An archaeological and artistic perspective. Antiquity 80(307): 9–24.
- Brown AG, Tooth S, Bullard JE, et al. (2017) The geomorphology of the Anthropocene: Emergence, status and implications. Earth Surface Processes and Landforms 42(1): 71–90.
- Buchanan A and Jones SK (1980) The Baimoral Bridge of I. K. Brunel. Industrial Archaeology Review 4(3): 214–226.
- Butzer KW (1974) Accelerated soil erosion: a problem of man-land relationships. In: Manners IR and Mikesell MW (eds) Perspectives on Environment: Essays Requested by the Panel on Environmental Education, Commission on College Geography. Washington, DC: Association of American Geographers, pp. 57–78.
- Butzer KW (1982) Archaeology as Human Ecology: Method and Theory for a Contextual Approach. Cambridge, UK: Cambridge University Press.
- Campbell I (2006) The past at the precipice. The Magazine of the Society for the Protection of Ancient Buildings 7: 305.
- Canuto MA, Estrada-Belli F, Garrison TG, et al. (2018) Ancient lowland Maya complexity as revealed by airborne laser scanning of northern Guatemala. Science 361: 6409.
- Cappucci S, Valentini E, Del Monte M, et al. (2017) Detection of natural and anthropic features on small Islands. Journal of Coastal Research 77: 73–87.
- Cassel P (2012) The Great Wall: A cultural history. Pacific Affairs 85(2): 395–397.
- Castelletti A, Pianosi F and Soncini-Sessa R (2008) Water reservoir control under economic, social and environmental constraints. Automatica 44(6): 1595–1607.
- Cavallo A, Di Donato B and Marino D (2016) Mapping and assessing urban agriculture in Rome. Agriculture and Agricultural Science Procedia 8: 774–783.
- Cazorzi F, Dalla Fontana G, De Luca A, et al. (2013) Drainage network detection and assessment of network storage capacity in agrarian landscape. Hydrological Processes 27: 541–553.
- Cerrillo-Cuenca E (2017) An approach to the automatic surveying of prehistoric barrows through LiDAR. Quaternary International 435: 135–145.
- Certini G and Scalenghe R (2011) Anthropogenic soils are the golden spikes for the Anthropocene. The Holocene 21(8): 1269–1274.
- Chao BF (1995) Anthropogenic impact on global geodynamics due to reservoir water impoundment. Geophysical Research Letters 22(24): 3529–3532.
- Chase A, Chase D, Awe J, et al. (2014) Ancient Maya regional settlement and inter-site analysis: The 2013 West-Central Belize LiDAR survey. Remote Sensing 6(9): 8671–8695.
- Chen J, Li K, Chang K-J, et al. (2015) Open-pit mining geomorphic feature characterization. International Journal of Applied Earth Observation and Geoinformation 42: 76–86.
- Chin A, O'Dowd AP and Gregory KJ (2013) Urbanization and river channels. Treatise on Geomorphology 9: 809–827.
- Cook-Patton SC, Weller D, Rick TC, et al. (2014) Ancient experiments: Forest biodiversity and soil nutrients enhanced by Native American middens. Landscape Ecology 29(6): 979–987.
- Corcoran P, Mooney P and Bertolotto M (2013) Analysing the growth of OpenStreetMap networks. Spatial Statistics 3(0): 21–32.
- Courty M-A and Vallverdú J (2001) The microstratigraphic record of abrupt climate changes in cave sediments of the Western Mediterranean. Geoarchaeology 16(5): 467–499.
- Crombé P, Langohr R and Louwagie G (2015) Mesolithic hearth-pits: Fact or fantasy? A reassessment based on the evidence from the sites of Doel and Verrebroek (Belgium). Journal of Archaeological Science 61: 158–171.
- Crommelinck S, Bennett R, Gerke M, et al. (2016) Review of automatic feature extraction from high-resolution optical sensor data for UAV-based cadastral mapping. Remote Sensing 8(8): 689.
- Cuezva S, García-Guinea J, Fernández-Cortes A, et al. (2016) Composition, uses, provenance and stability of rocks and ancient mortars in a Theban Tomb in Luxor (Egypt). Materials and Structures/Matériaux et Constructions 49(3): 941–960.
- Cuff D (2008) Anthropogeomorphology. In: Cuff D and Goudie A (eds) Oxford Companion to Global Change. Oxford: Oxford University Press.
- Dávid L (2010) Quarrying and other minerals. In: József S, Lóránt D and Dénes L (eds) Anthropogenic Geomorphology. Dordrecht: Springer Netherlands, pp. 113–130.
- David B and Thomas J (2016) Handbook of Landscape Archaeology. New York: Taylor & Francis.
- Day T (1995) Telford's Aberdeenshire bridges. Industrial Archaeology Review 17(2): 193–207.
- De Matos-Machado R, Bétard F, Bilodeau C, et al. (2015) Great War archaeo-geomorphology: Exploring the links between conflict-induced landforms and archaeological records in the battlefield of Verdun (North-eastern France). In: Discovering the Great War: Multidisciplinary Research of Modern Conflicts. Ljubljana/Kobariid, 2015.
- Deforce K, Boeren I, Adriaenssens S, et al. (2013) Selective woodland exploitation for charcoal production. A detailed analysis of charcoal kiln remains (ca. 1300–1900 AD) from Zoersel (northern Belgium). Journal of Archaeological Science 40(1): 681–689.
- Devereux BJ, Amable GS and Crow P (2008) Visualisation of LiDAR terrain models for archaeological feature detection. Antiquity 82(316): 470–479.
- Devic G (2015) Environmental impacts of reservoirs. In: Armon R and Hänninen O (eds) Environmental Indicators. Dordrecht: Springer.
- Diaz-Varela RA, Zarco-Tejada PJ, Angileri V, et al. (2014) Automatic identification of agricultural terraces through object-oriented analysis of very high resolution {DSMs} and multispectral imagery obtained from an unmanned aerial vehicle. Journal of Environmental Management 134: 117–126.
- Dinceaue DF (2000) Environmental Archaeology: Principles and Practice. Cambridge, UK: Cambridge University Press.
- Dixon SJ, Viles HA and Garrett BL (2017) Ozymandias in the Anthropocene: The city as an emerging landform. Area 50(1): 117–125.
- Donous M, Briese C, Fera M, et al. (2008) Archaeological prospection of forested areas using full-waveform airborne laser scanning. Journal of Archaeological Science 35(4): 882–893.
- Drăguț L and Blaschke T (2006) Automated classification of landform elements using object-based image analysis. Geomorphology 81(3–4): 330–344.
- Dumas V (2011) The Fight at Pont du Gard. Paris, France: Editions Tallandier, 771, 88.
- Easter TE (2004) Studies in Military Geography and Geology. Dordrecht: Springer Netherlands.
- Eckert S, Tesfay Ghebremicael S, Hurni H, et al. (2017) Identification and classification of structural soil conservation measures based on very high resolution stereo satellite data. Journal of Environmental Management 193: 592–606.
- Edgeworth M (2014) The relationship between archaeological stratigraphy and artificial ground and its significance in the Anthropocene. Geological Society, London, Special Publications 395(1): 91–108.
- Edgeworth M, deB Richter D, Waters C, et al. (2015) Diachronous beginnings of the Anthropocene: The lower bounding surface of anthropogenic deposits. The Anthropocene Review 2(1): 33–58.
- Ellis EC (2011) Anthropogenic transformation of the terrestrial biosphere. Philosophical transactions. Series A, Mathematical, Physical, and Engineering Sciences 369(1938): 1010–1035.
- Ellis EC (2015) Ecology in an anthropogenic biosphere. Ecological Monographs 85(3): 287–331.
- Ellis EC (2017) Physical geography in the Anthropocene. Progress in Physical Geography 41(5): 525–532.
- Ellis EC and Haff PK (2009) Earth science in the Anthropocene: New epoch, new paradigm, new responsibilities. Eos, Transactions American Geophysical Union 90(49): 473.
- Ellis EC and Ramankutty N (2008) Putting people in the map: anthropogenic biomes of the world. Frontiers in Ecology and the Environment 6: 439–447.
- Ellis EC, Kaplan JO, Fuller DQ, et al. (2013) Used planet: A global history. Proceedings of the National Academy of Sciences of the United States of America 110(20): 7978–7985.
- Ellis EC, Magliocca NR, Stevens CJ, et al. (2018) Evolving the Anthropocene: Linking multi-level selection with long-term social-ecological change. Sustainability Science 13(1): 119–128.
- Eltner A, Kaiser A, Castillo C, et al. (2015) Image-based surface reconstruction in geomorphometry – merits, limits and developments of a promising tool for geoscientists. Earth Surface Dynamics Discussions 3(4): 1445–1508.
- ElZein Z, Abdou A and ElGawad IA (2016) Constructed wetlands as a sustainable wastewater treatment method in communities. Procedia Environmental Sciences 34: 605–617.
- Erwin DH (2008) Macroevolution of ecosystem engineering, niche construction and diversity. Trends in Ecology & Evolution 23(6): 304–310.
- Evans DH (2016) Airborne laser scanning as a method for exploring long-term socio-ecological dynamics in Cambodia. Journal of Archaeological Science 74: 164–175.
- Evans DH, Fletcher RJ, Pottier C, et al. (2013) Uncovering archaeological landscapes at Angkor using lidar. Proceedings of the National Academy of Sciences of the United States of America 110(31): 12595–12600.
- Evans DH, Pottier C, Fletcher R, et al. (2007) A comprehensive archaeological map of the world's largest preindustrial settlement complex at Angkor, Cambodia. Proceedings of the National Academy of Sciences 104(36): 14277–14282.
- FAO (2001) Dams, fish and fisheries Opportunities, challenges and conflict resolution. FAO Fisheries Technical Paper.
- Farrand WR (2001) Archaeological sediments in rock-shelters and caves. In: Stein J and Farrand W (eds) Sediments in Archaeological Context. Salt Lake City (EEUU): The University of Utah Press, pp. 29–66.
- Fleming A (1999) Phenomenology and the megaliths of Wales: A dreaming too far? Oxford Journal of Archaeology 19(4): 119–125.
- Fleming A (2005) Megaliths and post-modernism: The case of Wales. Antiquity 79(306): 921–932.
- Fletcher R (2009) Low-density, agrarian-based urbanism: A comparative view. Insights 2(4): 2–19.
- Foley RA and Lahr MM (2015) Lithic landscapes: Early human impact from stone tool production on the Central Saharan Environment. PLOS ONE 10(3): e0116482.
- Fonstad MA, Dietrich JT, Courville BC, et al. (2013) Topographic structure from motion: a new development in photogrammetric measurement. Earth Surface Processes and Landforms 38(4): 421–430.
- Fowler MJF (2002) Satellite remote sensing and archaeology: A comparative study of satellite imagery of the environs of Figsbury Ring, Wiltshire. Archaeological Prospection 9(2): 55–69.
- Fox T, Pope M and Ellis EC (2017). Engineering the Anthropocene: Scalable social networks and resilience building in human evolutionary timescales. The Anthropocene Review 4: 199–215.
- Frankhauser P (2008) The Dynamics of Complex Urban Systems. Heidelberg: Physica-Verlag HD.
- Ghanea M, Moallem P and Momeni M (2016) Building extraction from high-resolution satellite images in urban areas: recent methods and strategies against significant challenges. International Journal of Remote Sensing 37(21): 5234–5248.
- Goes BJM, Parajuli UN, Haq M, et al. (2017) Karez (qanat) irrigation in the Helmand River Basin, Afghanistan: A vanishing indigenous legacy. Hydrogeology Journal 25(2): 269–286.
- Golden C, Murtha T, Cook B, et al. (2016) Environmental lidar data for archaeology: Mesoamerican applications and reanalyzing implications. Journal of Archaeological Science: Reports 9: 293–308.
- Goodchild MF and Mark DM (1987) The fractal nature of geographic phenomena. Annals of the Association of American Geographers 77(2): 265–278.
- Gordon E and Meentemeyer RK (2006) Effects of dam operation and land use on stream channel morphology and riparian vegetation. Geomorphology 82(3–4): 412–429.
- Goudie A (2018) The human impact in geomorphology – 50 years of change. Geomorphology. Doi: 10.1016/j.geomorph.2018.12.002.
- Goudie A and Viles HA (2016) Geomorphology in the Anthropocene. New York: Cambridge University Press.
- Gregory KJ (2006) The human role in changing river channels. Geomorphology 79(3–4): 172–191.
- Guthrie R (2015) The catastrophic nature of humans. Nature Geoscience 8(6): 421–422.
- Guyot A, Hubert-Moy L and Lorho T (2018) Detecting Neolithic burial mounds from LiDAR-derived elevation data using a multi-scale approach and machine learning techniques. Remote Sensing 10: 225.
- Haas F, Hilger L, Neugirg F, et al. (2016) Quantification and analysis of geomorphic processes on a recultivated iron ore mine on the Italian island of Elba using long-term ground-based lidar and photogrammetric SfM data by a UAV. Natural Hazards and Earth System Sciences 16(5): 1269–1288.
- Hall TE and Shelby B (2000) Temporal and spatial displacement: Evidence from a high-use reservoir and alternate sites. Journal of Leisure Research 32(4): 435–456.
- Hanedar AO (2017) Transportation Infrastructure and Economic Growth in a Dissolving Country: (Ir)relevance of Railroads in the Ottoman Empire. MPRA Paper No. 77974, University Library of Munich, Germany.
- Haralick RM (1982) 18 Image texture survey. Handbook of Statistics 2: 399–415.
- Harandi MF and de Vries MJ (2014) An appraisal of the qualifying role of hydraulic heritage systems: A case study of Qanats in central Iran. Water Science and Technology: Water Supply 14(6): 1124–1132.
- Harmon JM, Leone MP, Prince SD, et al. (2006) LiDAR for archaeological landscape analysis: A case study of two eighteenth-century Maryland plantation sites. American Antiquity 71(4): 649–670.
- Hartman HL and Mutmanský JM (2002) Introductory Mining Engineering. Hoboken, New Jersey: John Wiley & Sons.
- Hay GJ and Castilla G (2008) Geographic Object-Based Image Analysis (GEOBIA): A new name for a new discipline. In: Blaschke T, Land S and Hay G (eds)
- Object-Based Image Analysis. Berlin: Springer science & business media, pp. 75–89.
- Herrington R (2013) Road map to mineral supply. Nature Geoscience 6(11): 892–894.
- Hesse R (2010) LiDAR-derived Local Relief Models - A new tool for archaeological prospection. Archaeological Prospection 17(2): 67–72.
- Holcomb DW (2001) Imaging radar and archaeological survey: An example from the Gobi Desert of Southern Mongolia. Journal of Field Archaeology 28(1/2): 131.
- Holcomb DW and Shingiray IL (2006) Imaging radar in archaeological investigations: An image processing perspective. In: James RW and Farouk E (eds) Remote Sensing in Archaeology. New York: Springer New York, pp. 11–45.
- Holtorf CJ (1998) The life-histories of megaliths in Mecklenburg-Vorpommern (Germany). World Archaeology 30(1): 23–38.
- Hooke RL and Martin-Duque JF (2012) Land transformation by humans: A review. GSA Today 22(12): 4–10.
- Houx J (2001) Trench warfare alternative trenching methods help with speed and efficiency. Grounds Maintenance 36(6): 28–31.
- Howey MCL, Sullivan FB, Tallant J, et al. (2016) Detecting precontact anthropogenic microtopographic features in a forested landscape with lidar: a case study from the upper great lakes region, AD 1000–1600. PLoS ONE 11(9): e0162062.
- Hupy JP and Schaeztl RJ (2006) Introducing “bombturbation”, a singular type of soil disturbance and mixing. Soil Science 171(11): 823–836.
- Ilyés Z (2010) Military activities: Warfare and defence. In: József S, Lőránt D and Dénes L (eds) Anthropogenic Geomorphology. Dordrecht: Springer Netherlands, pp. 217–231.
- Institut Cartografic De Catalunya (ICC) (2005) Informe del levantamiento lidar del Territorio Historico de Gipuzkoa.
- Institut Cartografic de Catalunya (ICC) (2008) Informe final del proyecto MDT LiDAR del Territorio Historico de Gipuzkoa.
- Issar AS (2008) A tale of two cities in ancient Canaan: How the groundwater storage capacity of Arad and Jericho decided their history. Geological Society Special Publication 288(1): 137–143.
- James MR and Robson S (2012) Straightforward reconstruction of 3D surfaces and topography with a camera: Accuracy and geoscience application. Journal of Geophysical Research: Earth Surface 117: F03017.
- Jiang B and Brandt S (2016) A fractal perspective on scale in geography. ISPRS International Journal of Geo-Information 5(6): 95.
- Johnson KM and Ouimet WB (2016) Physical properties and spatial controls of stone walls in the northeastern USA: Implications for Anthropocene studies of 17th to early 20th century agriculture. Anthropocene 15: 22–36.
- Johnson KM and Ouimet WB (2018) An observational and theoretical framework for interpreting the landscape palimpsest through airborne LiDAR. Applied Geography 91: 32–44.
- Judson BF, Kornfeld M, Andrews BN, et al. (2005) Rockshelter archaeology and geoarchaeology in the Big Horn Mountains, Wyoming. The Plains Anthropologist 50(195): 227–248.
- Kara BY and Verter V (2004) Designing a road network for hazardous materials transportation. Transportation Science 38(2): 188–196.
- Kennedy D (2011) The ‘Works of the Old Men’ in Arabia: Remote sensing in interior Arabia. Journal of Archaeological Science 38(12): 3185–3203.
- Kennelly PJ (2008) Terrain maps displaying hill-shading with curvature. Geomorphology 102(3–4): 567–577.
- Kiernan K (2015) Nature, severity and persistence of geomorphological damage caused by armed conflict. Land Degradation & Development 26(4): 380–396.
- Kirch PV (2005) Archaeology and global change: The Holocene Record. Annual Review of Environment and Resources 30(1): 409–440.
- Kircher M, Roth A, Adam N, et al. (2003) Remote sensing observation of mining induced subsidence by means of differential SAR-interferometry. In: IEEE International Geoscience and Remote Sensing Symposium (eds Fawwaz T, et al.), Toulouse, France, 21–25 July, pp. 209–211. Piscataway, NJ: The Institute of Electrical and Electronics Engineers.
- Kollyropoulos K, Georma F, Saranti F, et al. (2017) Urban planning and water management in Ancient Aetolian Makynceia, Western Greece. Water Science and Technology: Water Supply 17(3): 621–631.
- Kumar R, Jain V, Prasad Babu G, et al. (2014) Connectivity structure of the Kosi megafan and role of rail-road transport network. Geomorphology 227: 73–86.
- Lane SN, Westaway RM and Hicks DM (2003) Estimation of erosion and deposition volumes in a large,
- gravel-bed, braided river using synoptic remote sensing. Earth Surface Processes and Landforms 28(3): 249–271.
- Launderville D (2013) The Book of Ezekiel and Mesopotamian City Laments. Catholic Biblical Quarterly 75(4): 778–779.
- Le TVH, Nguyen HN, Wolanski E, et al. (2007) The combined impact on the flooding in Vietnam's Mekong River delta of local man-made structures, sea level rise, and dams upstream in the river catchment. Estuarine, Coastal and Shelf Science 71(1-2): 110–116.
- Lewis SL and Maslin MA (2015) Geological evidence for the Anthropocene. Science 349(6245): 246–247.
- Li J, Yang L, Pu R, et al. (2017) A review on anthropogenic geomorphology. Journal of Geographical Sciences 27(1): 109–128.
- Li L (2017) Geography of railroads. In: Handbook on Geographies of Technology. Cheltenham, UK: Edward Elgar Publishing, 242–253.
- Liu B, Wang N, Chen M, et al. (2017) Earliest hydraulic enterprise in China, 5,100 years ago. Proceedings of the National Academy of Sciences of the United States of America 114(52): 13637–13642.
- Liu C, Duan D and Zhang H (2014) Relationships between fractal road and drainage networks in Wuling mountainous area: Another symmetric understanding of human–environment relations. Journal of Mountain Science 11(4): 1060–1069.
- Luo L, Wang X, Guo H, et al. (2014) Automated extraction of the archaeological tops of qanat shafts from VHR imagery in google earth. Remote Sensing 6(12): 11956–11976.
- Luscombe DJ, Anderson K, Gatis N, et al. (2015) What does airborne LiDAR really measure in upland ecosystems? Ecohydrology 8(4): 584–594.
- Martin-Antón M, Negro V, del Campo JM, et al. (2016) Review of coastal land reclamation situation in the world. Journal of Coastal Research 75: 667–671.
- Martinović K, Gavin K, Reale C, et al. (2018) Rainfall thresholds as a landslide indicator for engineered slopes on the Irish Rail network. Geomorphology 306(1): 40–50.
- McCoy MD, Asner GP and Graves MW (2011) Airborne lidar survey of irrigated agricultural landscapes: an application of the slope contrast method. Journal of Archaeological Science 38(9): 2141–2154.
- McDonald EV and Schumer R (2016) Use of ground-based LiDAR for detection of IED command wires on typical desert surfaces. In: McDonalds Eric V and Bullard T (eds) Military Geosciences and Desert Warfare. New York: Springer New York, 297–309.
- Menze BH, Ur JA and Sherratt AG (2006) Detection of ancient settlement mounds. Photogrammetric Engineering & Remote Sensing 72(3): 321–327.
- Meyfroidt P, Lambin EF, Erb K-H, et al. (2013) Globalization of land use: distant drivers of land change and geographic displacement of land use. Current Opinion in Environmental Sustainability 5: 438–444.
- Midgley MS (2010) Monuments and monumentality: The cosmological model of the world of megaliths. Documenta Praehistorica 37(1): 55–64.
- Moore E, Freeman T and Hensley S (2006) Spaceborne and airborne radar at Angkor: Introducing new technology to the ancient site. In: Wiseman JR and El-Baz F (eds) Remote Sensing in Archaeology. New York: Springer New York, 185–216.
- Morriss RK (2003) The Archaeology of Railways. Stroud, UK: Tempus Publishing.
- Morriss RK (2005) Roads: Archaeology and Architecture. Stroud, UK: Tempus Publishing.
- Moss ML and Erlandson JM (1992) Forts, refuge rockes, and defensive sites: The antiquity of warfare along the North Pacific Coast of North America. Arctic Anthropology 29(2): 73–90.
- Mossa J and James LA (2013) Impacts of mining on geomorphic systems. In: Shroder J, James LA, Harden CP, et al. (eds) Treatise on Geomorphology, vol. 13, Geomorphology of Human Disturbances, Climate Change, and Natural Hazards, pp. 74–95.
- Mostafa Y and Abdelhafiz A (2017) Shadow identification in high resolution satellite images in the presence of water regions. Photogrammetric Engineering & Remote Sensing 83: 87–94.
- Mwendera EJ, Saleem MAM and Dibabe A (1997) The effect of livestock grazing on surface runoff and soil erosion from sloping pasture lands in the Ethiopian highlands. Australian Journal of Experimental Agriculture 37(4): 421.
- Nerlove M (1966) Railroads and American economic growth. The Journal of Economic History 26(1): 107–115.
- O'Neal MA (2012) An objective approach to defining earthwork geometries using subdecimeter digital elevation models. Geoarchaeology 27(2): 157–165.
- Opitz RS and Cowley D (2013) Interpreting Archaeological Topography: 3D Data, Visualization and
- Observation. In: Rachel S and David C (eds) Oxford, UK: Oxbow Books.
- Owereem I, Kettner AJ and Syvitski JPM (2013) Impacts of humans on river fluxes and morphology. In: Shroder J (ed.) Treatise on Geomorphology, Volume 9: Fluvial Geomorphology, pp. 828–842.
- Pearson MP and Pearson MP (1999) The Archaeology of Death and Burial. Oxford, UK: Sutton Publishing.
- Petrov LO, Lavalle C and Kasanko M (2009) Urban land use scenarios for a tourist region in Europe: Applying the MOLAND model to Algarve, Portugal. Landscape and Urban Planning 92(1): 10–23.
- Pike RJ (2000) Geomorphometry - Diversity in quantitative surface analysis. Progress in Physical Geography 24(1): 1–20.
- Portal C (2017) The artificial mountain: a new form of “Artialization” of Nature? Journal of Alpine Research/Revue de Géographie Alpine 105: 1–2.
- Power JT (2009) Trench warfare under Grant and Lee: Field fortifications in the overland campaign. Civil War History 55(3): 420–422.
- Pratesi F, Tapete D, Del Ventisette C, et al. (2016) Mapping interactions between geology, subsurface resource exploitation and urban development in transforming cities using InSAR Persistent Scatterers: Two decades of change in Florence, Italy. Applied Geography 77: 20–37.
- Prosdociimi M, Calligaro S, Sofia G, et al. (2016) Bank erosion in agricultural drainage networks: new challenges from Structure-from-Motion photogrammetry for post-event analysis. Earth Surface Processes and Landforms 40: 1891–1906.
- Purinton B and Bookhagen B (2017) Validation of digital elevation models (DEMs) and comparison of geomorphic metrics on the southern Central Andean Plateau. Earth Surface Dynamics 5(2): 211–237.
- Qin R, Tian J and Reinartz P (2016) 3D change detection - Approaches and applications. ISPRS Journal of Photogrammetry and Remote Sensing 122: 41–56.
- Quattulli M and Olaiola IG (2013) A review of EO image information mining. ISPRS Journal of Photogrammetry and Remote Sensing 75: 11–28.
- Richards JA (2013) Remote Sensing Digital Image Analysis: An Introduction. Berlin: Springer.
- Rick TC, Erlandson JM, Vellanoweth RL, et al. (2005) From pleistocene mariners to complex hunter-gatherers: The archaeology of the california channel islands. Journal of World Prehistory 19(3): 169–228.
- Ricketson O, Kidder AV, Jones JG, et al. (2003) An archeological reconnaissance by air in Central America. Geographical Review 20(2): 177.
- Riley MA (2012) Lidar Surveyor: A Tool for Automated Archaeological Feature Extraction from Light Detection and Ranging (LiDAR) Elevation Data. Iowa, US: University of Iowa.
- Risbol O, Bollandås OM, Nesbakken A, et al. (2013) Interpreting cultural remains in airborne laser scanning generated digital terrain models: Effects of size and shape on detection success rates. Journal of Archaeological Science 40(12): 4688–4700.
- Rivas V, Cendrero A, Hurtado M, et al. (2006) Geomorphic consequences of urban development and mining activities: An analysis of study areas in Spain and Argentina. Geomorphology 73(3–4): 185–206.
- Roberts P, Hunt C, Arroyo-Kalin M, et al. (2017) The deep human prehistory of global tropical forests and its relevance for modern conservation. Nature Plants 3(8): 17093.
- Rodriguez-Iturbe I and Rinaldo A (1997) Fractal River Basins: Chance and Self-Organization. Cambridge, UK: Cambridge University Press.
- Roebroeks W and Villa P (2011) On the earliest evidence for habitual use of fire in Europe. Proceedings of the National Academy of Sciences of the United States of America 108(13): 5209–5214.
- Rojas C (2010) The Great Wall: A Cultural History. Cambridge, MA: Harvard University Press.
- Ruiz R (2016) Modern road archaeology: Identification and classification proposal. International Journal of Historical Archaeology 20(2): 437–462.
- Sandgathe DM and Berna F (2017) Fire and the genus Homo: An introduction to supplement 16. Current Anthropology 58(S16): S165–S174.
- Sauer CO (1925) The morphology of landscape. University of California Publications in Geography 2(2): 19–53.
- Scarborough VL (2017) The hydraulic lift of early states societies. Proceedings of the National Academy of Sciences of the United States of America 114(52): 13600–13601.
- Schindling J and Gibbs C (2014) LiDAR as a tool for archaeological research: A case study. Archaeological and Anthropological Sciences 6(4): 411–423.
- Schmidhuber J (2015) Deep learning in neural networks: An overview. Neural Networks 61: 85–117.
- Schneider A, Takla M, Nicolay A, et al. (2015) A Template-matching approach combining morphometric variables for automated mapping of charcoal kiln sites. Archaeological Prospection 22(1): 45–62.
- Seto KC and Fragkias M (2005) Quantifying spatio-temporal patterns of urban land-use change in four cities of China with time series landscape metrics. Landscape Ecology 20(7): 871–888.
- Shahack-Gross R, Berna F, Karkanas P, et al. (2014) Evidence for the repeated use of a central hearth at middle pleistocene (300ky ago) Qesem Cave, Israel. Journal of Archaeological Science 44(1): 12–21.
- Shakir Aa and Mohammed AA (2013) Manufacturing of bricks in the past, in the present and in the future: A state of the art review. International Journal of Advances in Applied Sciences (IJAAS) 2(3): 145–156.
- Sharma VK (2010) Introduction to Process Geomorphology. Boca Raton, FL: CRC Press, pp. 415.
- Sidebotham SE (2014) Religion and burial at the Ptolemaic-Roman Red Sea emporium of Berenike, Egypt. African Archaeological Review 31(4): 599–635.
- Simms SR and Russell KW (1997) Tur Imdai Rockshelter: Archaeology of recent pastoralists in Jordan. Journal of Field Archaeology 24(4): 459–472.
- Smith BD (2007) Niche construction and the behavioral context of plant and animal domestication. Evolutionary Anthropology: Issues, News, and Reviews 16(5): 188–199.
- Smith BD (2013) Modifying landscapes and mass kills: Human niche construction and communal ungulate harvests. Quaternary International 297: 8–12.
- Smith BD and Zeder MA (2013) The onset of the Anthropocene. Anthropocene 4: 8–13.
- Snead JE, James E, Erickson CL, et al. (2009) Landscapes of Movement: Trails, Paths, and Roads in Anthropological Perspective. Philadelphia, PA: University of Pennsylvania Press.
- Sofia G, Bailly J-S, Chhehata N, et al. (2016a) Comparison of pleiades and LiDAR digital elevation models for terraces detection in farmlands. IEEE Journal of Selected Topics in Applied Earth Observations and Remote Sensing 9(4): 1567–1576.
- Sofia G, Dalla Fontana G and Tarolli P (2014a) High-resolution topography and anthropogenic feature extraction: Testing geomorphometric parameters in floodplains. Hydrological Processes 28(4): 2046–2061.
- Sofia G, Hillier JK and Conway SJ (2016b) Frontiers in geomorphometry and earth surface dynamics: Possibilities, limitations and perspectives. Earth Surface Dynamics 4: 721–725.
- Sofia G, Marinello F and Tarolli P (2014b) A new landscape metric for the identification of terraced sites: The Slope Local Length of Auto-Correlation (SLLC). ISPRS Journal of Photogrammetry and Remote Sensing 96: 123–133.
- Sofia G, Marinello F and Tarolli P (2016c) Metrics for quantifying anthropogenic impacts on geomorphology: Road networks. Earth Surface Processes and Landforms 41(2): 240–255.
- Sofia G, Prosdociimi M, Dalla Fontana G, et al. (2014c) Modification of artificial drainage networks during the past half-century: Evidence and effects in a reclamation area in the Veneto floodplain (Italy). Anthropocene 6: 48–62.
- Sofia G, Ragazzi F, Giandon P, et al. (2019) On the linkage between runoff generation, land drainage, soil properties, and temporal patterns of precipitation in agricultural floodplains. Advances in Water Resources 124: 120–138.
- Sofia G and Tarolli P (2017) Hydrological response to ~30 years of agricultural surface water management. Land 6(1): 3.
- Sowmya A and Trinder J (2000) Modelling and representation issues in automated feature extraction from aerial and satellite images. ISPRS Journal of Photogrammetry and Remote Sensing 55(1): 34–47.
- Sparavigna AC (2010) Geoglyphs of Titicaca as an ancient example of graphic design. Computing Research Repository 1009: 4602.
- Stal C, Bourgeois J, De Maeyer P, et al. (2010) Kemmelsberg (Belgium) case study: Comparison of DTM analysis methods for the detection of relicts from the First World War. In: 30th EARSeL symposium 2010 on remote sensing for science, education, and natural and cultural heritage. Paris, France, 31 May–3 June 2010, 65–72. Paris: European Association of Remote Sensing Laboratories.
- Stirling J (2015) The modern midden: Visualising waste through information design. In: University of Wollongong Thesis Collection 1954–2016.
- Strano E, Nicosia V, Latora V, et al. (2012) Elementary processes governing the evolution of road networks. Scientific Reports 2(2012): 296.
- Štular B, Kokalj Ž, Oštrik K, et al. (2012) Visualization of lidar-derived relief models for detection of
- archaeological features. Journal of Archaeological Science 39(11): 3354–3360.
- Swamee PK and Chahar BR (2015) General principles of canal design. In: Swamee PK and Chahar BR (eds) Design of Canals. Springer, New Delhi: Springer Transactions in Civil and Environmental Engineering, pp. 59–77.
- Szabó J (2010) Anthropogenic geomorphology: subject and system. In: Szabó J, Dávid L and Lóczy D (eds) Anthropogenic Geomorphology. Dordrecht: Springer.
- Tapete D, Banks V, Jones L, et al. (2017) Contextualising archaeological models with geological, airborne and terrestrial LiDAR data: The Ice Age landscape in Farndon Fields, Nottinghamshire, UK. Journal of Archaeological Science 81: 31–48.
- Tapete D, Cigna F, Masini N, et al. (2013) Prospection and monitoring of the archaeological heritage of Nasca, Peru, with envisat asar. Archaeological Prospection 20(2): 133–147.
- Tarboton DG, Bras RL and Rodriguez-Iturbe I (1988) The fractal nature of river networks. Water Resources Research 24(8): 1317–1322.
- Tarolli P (2014) High-resolution topography for understanding Earth surface processes: Opportunities and challenges. Geomorphology 216: 295–312.
- Tarolli P (2016) Humans and the Earth's surface. Earth Surface Processes and Landforms 41: 2301–2304.
- Tarolli P, Calligaro S, Cazorzi F, et al. (2013) Recognition of surface flow processes influenced by roads and trails in mountain areas using high-resolution topography. European Journal Of Remote Sensing 46: 176–197.
- Tarolli P, Cavalli M and Masin R (2019). High-resolution morphologic characterization of conservation agriculture. Catena 172: 846–856.
- Tarolli P, Preti F and Romano N (2014) Terraced landscapes: From an old best practice to a potential hazard for soil degradation due to land abandonment. Anthropocene 6: 10–25.
- Tarolli P and Sofia G (2016) Human topographic signatures and derived geomorphic processes across landscapes. Geomorphology 255: 140–161.
- Tarolli P, Sofia G, Cao W, et al. (2018) The geomorphology of the human age. In: Dellasala D and Goldstein M (eds) Encyclopedia of the Anthropocene. Oxford, UK; Waltham MA: Elsevier, pp. 35–43.
- Tarolli P, Sofia G and Ellis E (2017) Mapping the topographic fingerprints of humanity across Earth. Eos 98: 13–15.
- Tegel W, Elburg R, Hakelberg D, et al. (2012) Early Neolithic water wells reveal the world's oldest wood architecture. PLoS One 7(12): e51374.
- Terry TA and Hughes JH (1978) Drainage of excess water—Why and how. In: proceedings on soil moisture site productivity symposium (ed Balmer WE), Myrtle Beach, S.C., 1–3 November 1977, pp. 148–166. Atlanta, GA: USDA For. Serv.
- Thomas I, Frankhauser P and Biernacki C (2008) The morphology of built-up landscapes in Wallonia (Belgium): A classification using fractal indices. Landscape and Urban Planning 84(2): 99–115.
- Thoms MC, Southwell M and McGinness HM (2005) Floodplain-river ecosystems: Fragmentation and water resources development. Geomorphology 71(1–2): 126–138.
- Timberlake S (2017) New ideas on the exploitation of copper, tin, gold, and lead ores in Bronze Age Britain: The mining, smelting, and movement of metal. Materials and Manufacturing Processes 32(7–8): 709–727.
- Tomczyk J, Jedrychowska-Dańska K, Płoszaj T, et al. (2011) Anthropological analysis of the osteological material from an ancient tomb (Early Bronze Age) from the middle Euphrates valley, Terqa (Syria). International Journal of Osteoarchaeology 21(4): 435–445.
- Toy TJ and Hadley RF (1987) Geomorphology and Reclamation of Disturbed Lands. Orlando, FL: Academic Press.
- Trebsche P (2009) Does form follow function? Towards a methodical interpretation of archaeological building features. World Archaeology 41(3): 505–519.
- Valentine A and Kalnins L (2016) An introduction to learning algorithms and potential applications in geomorphometry and earth surface dynamics. Earth Surface Dynamics Discussions 4(2): 1–23.
- van der Spek RJ (Bert) (2017) The making of the ancient Greek economy. Institutions, markets, and growth in the city-states. Journal of Economic History 77(2): 601–604.
- Vidal O, Goffé B, Arndt N, et al. (2013) Metals for a low-carbon society. Nature Geosci 6(11): 894–896.
- Vogel H (1987) Terrace farming in Yemen. Journal of Soil and Water Conservation 42(1): 18–21.
- Vörösmarty CJ, Meybeck M, Fekete B, et al. (2003) Anthropogenic sediment retention: Major global impact from registered river impoundments. Global and Planetary Change 39(1–2): 169–190.
- Vörösmarty CJ, Lettenmaier D, Levêque C, et al. (2004) Human transforming the Global Water System. Eos 85(48): 509–520.
- Vrancic T (2010) Pont Du Gard - Pearl of the architectural heritage. Gradevinar 62(9): 857–859.
- Vymazal J and Kröpfelová L (2008) The use of HF Constructed Wetlands in the World. In: Vymazal J and Kröpfelová L (eds) Wastewater Treatment in Constructed Wetlands with Horizontal Sub-Surface Flow. Springer, Dordrecht: Environmental Pollution, pp. 355–432.
- Wandsnider L (1997) The roasted and the boiled: Food composition and heat treatment with special emphasis on pit-hearth cooking. Journal of Anthropological Archaeology 16(1): 1–48.
- Wassie YA, Koeva MN, Bennett RM, et al. (2017) A procedure for semi-automated cadastral boundary feature extraction from high-resolution satellite imagery. Journal of Spatial Science 63: 1–18.
- Waters CN, Zalasiewicz J, Summerhayes C, et al. (2016) The Anthropocene is functionally and stratigraphically distinct from the Holocene. Science 351(6269): 2622.
- Watson B, Brigham T, Dyson T, et al. (2001) London Bridge: 2000 Years of a River Crossing. London: Museum of London Archaeology Service.
- Wessels J (2014) Qanats and Water Cooperation for a Sustainable Future. Washington D.C: Middle East Institute (MEI).
- Wheaton JM, Brasington J, Darby SE, et al. (2010) Accounting for uncertainty in DEMs from repeat topographic surveys: Improved sediment budgets. Earth Surface Processes and Landforms 35(2): 136–156.
- Wilkinson BH and McElroy BJ (2007) The impact of humans on continental erosion and sedimentation. Geological Society of America Bulletin 119: 140–156.
- Witharana C (2012) Who does what where? Advanced earth observation for humanitarian crisis management. In: 2012 IEEE 6th international conference on information and automation for sustainability, Beijing, China, 27–29 September.
- Witharana C and Civco DL (2012) Evaluating remote sensing image fusion algorithms for use in humanitarian crisis management. In: Michel U, Civco DL, Ehlers M, et al. (eds) SPIE Remote Sensing, Edinburgh, United Kingdom, 24–27 September 2012.
- Wrangham RW (2009) Catching Fire: How Cooking made us Human. New York: Basic Books.
- Wróżyński R, Pyszyński K, Sojka M, et al. (2017) Ground volume assessment using 'Structure from Motion' photogrammetry with a smartphone and a compact camera. Open Geosciences 9(1): 2156–2202.
- Wu J, Feng Y, Zhang X, et al. (2017) Grazing exclusion by fencing non-linearly restored the degraded alpine grasslands on the Tibetan Plateau. Scientific Reports 7: 15202.
- Xiang J, Chen J, Sofia G, et al. (2018) Open-pit mine geomorphic changes analysis using multi-temporal UAV survey. Environmental Earth Sciences 77: 220.
- Yatsko A (2016) Military development and geographic change on san diego bay. In: McDonald E and Bullard T (eds) Military Geosciences and Desert Warfare. Springer, New York, NY: Advances in Military Geosciences.
- Yevjevich V (1992) Water and civilization. Water International 17(4): 163–171.
- Yong-Zhong S, Yu-Lin L, Jian-Yuan C, et al. (2005) Influences of continuous grazing and livestock exclusion on soil properties in a degraded sandy grassland, Inner Mongolia, northern China. Catena 59(3): 267–278.
- Yucel MA and Turan RY (2016) Areal change detection and 3D modeling of mine lakes using high-resolution unmanned aerial vehicle images. Arabian Journal for Science and Engineering 41(12): 4867–4878.
- Zalasiewicz J, Waters CN and Williams M (2014) Human bioturbation, and the subterranean landscape of the Anthropocene. Anthropocene 6: 3–9.
- Zalasiewicz J, Williams M, Waters CN, et al. (2017) Scale and diversity of the physical technosphere: A geological perspective. The Anthropocene Review 4: 9–22.
- Zhang D, Gersberg RM and Keat TS (2009) Constructed wetlands in China. Ecological Engineering 35: 1367–1378.
- Zhang Y and Zhao W (2015) Vegetation and soil property response of short-time fencing in temperate desert of the Hexi Corridor, northwestern China. Catena 133: 43–51.