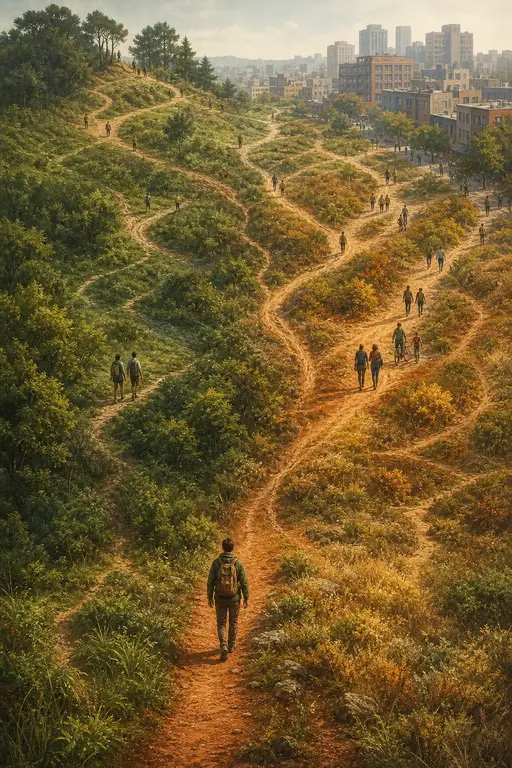
Modelling the Evolution of Human Trail Systems
1. Modelling the Evolution of Human Trail Systems
Dirk Helbing
II. Institute of Theoretical Physics, Pfaffenwaldring 57/III, 70550 Stuttgart, Germany
Joachim Keltsch
Science+Computing, Hagellocher Weg 71, 72070 Tübingen, Germany
Péter Molnár
The Center of Theoretical Studies of Physical Systems, 223 James P. Brawley Drive, Atlanta, Georgia 30314, USA
Many human social phenomena, such as cooperation [1–3], the growth of settlements [4], traffic dynamics [5–7] and pedestrian movement [7–10], appear to be accessible to mathematical descriptions that invoke self-organization [11,12]. Here we develop a model of pedestrian motion to explore the evolution of trails in urban green spaces such as parks. Our aim is to address such questions as what the topological structures of these trail systems are [13], and whether optimal path systems can be predicted for urban planning. We use an ‘active walker’ model [14–19] that takes into account pedestrian motion and orientation and the concomitant feedbacks with the surrounding environment. Such models have previously been applied to the study of complex structure formation in physical [14–16], chemical [17] and biological [18,19] systems. We find that our model is able to reproduce many of the observed large-scale spatial features of trail systems.
Previous studies have shown that various observed self-organization phenomena in pedestrian crowds can be simulated very realistically. This includes the emergence of lanes of uniform walking direction and oscillatory changes of the passing direction at bottlenecks [7,10]. Another interesting collective effect of pedestrian motion, which we have investigated very recently, is the formation of trail systems in green areas. In many cases, the pedestrians' desire to take the shortest way and the specific properties of the terrain are insufficient for an explanation of the trail characteristics. It is essential to include the effect of human orientation. To simulate the typical features of trail systems, we have extended the aforementioned model of pedestrian motion to an active walker model by introducing equations for environmental changes and their impact on the chosen walking direction.
First, we represent the ground structure at place and time by a function which reflects the comfort of walking. Trails are characterized by particularly large values of . On the one hand, at their positions , all pedestrians leave footprints on the ground (e.g. by trampling down some vegetation). Their intensity is assumed to be , since the clarity of a trail is limited to a maximum value . This causes a saturation effect of the ground's alteration by new footprints. On the other hand, the ground structure changes due to the vegetation's regeneration. This will lead to a restoration of the natural ground conditions with a certain weathering rate which is related to the durability of trails. Thus, the equation of environmental changes reads
where denotes Dirac's delta function (which yields only a contribution for ).
The attractiveness of a trail segment at place from the perspective of place decreases with its distance and depends on the visibility . Considering this by a factor and taking the spatial average by integration of the weighted ground structure over the green area, we obtain
The trail potential reflects the attractiveness of walking at place . It describes indirect long-range interactions via environmental changes, which are essential for the characteristics of the evolving patterns [18].
On a plain, homogeneous ground, the walking direction of pedestrian is determined by the direction of the next destination , i.e. . Without a destination, a pedestrian is expected to move into the direction of the largest increase of ground attraction, which is given by the (normalized) gradient of the trail potential. However, since the choice of the walking direction is influenced by the destination and existing trails at the same time, the orientation relation
was taken as the arithmetic average of both effects. Considering cases of rare interactions, the approximate equation of motion of a pedestrian with desired velocity is
A comparison of simulation results with photographs shows that the above described model is in good agreement with empirical observations. In particular, the evolution of the unexpected ‘island’ in the middle of the trail system in Figure 1 can be correctly described (Figure 2). The goodness of fit of the model is quite surprising, since it contains only two independent parameters and , where denotes the average of the desired velocities . This can be shown by scaling the model to dimensionless equations. The parameter was kept constant.
Our simulations base on a discretization of the considered area in small quadratic elements of equal size, which converts the integral (2) into a sum. Temporal and spatial derivatives are approximated by difference quotients. The presented examples begin with plain, homogeneous ground. All pedestrians have their own destinations and entry points, from which they start at a randomly chosen point in time. In Figure 2 (Figure 3) pedestrians move between all possible pairs of three (four) fixed places. While in Figure 4 the entry points and destinations are distributed over the small ends of the ground.
At the beginning, pedestrians take the direct ways to their respective destinations. However, after some time they begin to use already existing trails, since this is more comfortable than to clear new ways. By this, a kind of selection process [20,21,16] between trails sets in: Frequently used trails are more attractive than others. For this reason they are chosen very often, and the resulting reinforcement makes them even more attractive. However, the weathering effect destroys rarely used trails and limits the maximum length of the way system which can be supported by a certain rate of trail usage. As a consequence, the trails begin to bundle, especially where different trails meet or intersect. This explains, why pedestrians with different destinations use and produce common parts of the trail system (Figures 2 and 3).
A direct way system (which provides the shortest connections, but covers a lot of space) only develops if all ways are almost equally comfortable. If the advantage of using existing trails is large, the final trail system is a minimal way system (which is the shortest way system that connects all entry points and destinations). For realistic values of , the evolution of the trail system stops before this state is reached (Figure 2). Thus, is related to the average relative detour of the walkers. We conjecture that the resulting way system is the shortest one which is compatible with a certain accepted relative detour. In this sense, it yields an optimal compromise between convenience and shortness.
Therefore, we suggest to use the above model as a tool for urban planners and landscape gardeners, who have the dilemma to build most comfortable way systems at minimal construction costs. For planning purposes one needs to know the entry points and destinations within the considered area and the rates of usage of their connections. If necessary, these can be estimated by trip chaining models [22], which are also needed in cases of complex lines of access and sight. The effects of the physical terrain and already existing ways can be taken into account by the function . By varying the model parameter , the overall length of the resulting trail system can be influenced (Figures 2 and 3). In the same way, one can check its structural stability. Presently, we are evaluating typical parameter values of and by comparison of simulation results with real pedestrian flows which are reconstructed from video films by image processing. These values shall be used for designing convenient way systems in residential areas, parks, and recreation areas by means of computer simulations (Figure 3). We expect that such way systems will actually be accepted, since they take into account the route choice habits of pedestrians.
In summary, the presented active walker model is able to describe the self-organization and the typical structural properties of human trail systems. It will be interesting to relate our model to the work on space syntax [23]. Repulsive interactions between pedestrians can be taken into account by generalizing equation (4) in accordance with the social force model of pedestrian motion [7,10]. However, these are only relevant in cases of frequent pedestrian interactions, in which they lead to broader trails.
2. REFERENCES
- [1] Axelrod, R. & Dion, D. The further evolution of cooperation. Science 242, 1385–1390 (1988).
- [2] Clearwater, S. H., Huberman, B. A. & Hogg, T. Cooperative solution of constraint satisfaction problems, Science 254, 1181–1183 (1991).
- [3] Helbing, D. Quantitative Sociodynamics. Stochastic Methods and Social Interaction Processes (Kluwer Academic, Dordrecht, 1995).
- [4] Makse, H. A., Havlin, S. & Stanley, H. E. Modelling urban growth patterns, Nature 377, 608–612 (1995).
- [5] Herman, R., Lam, T. & Prigogine, I. Multilane vehicular traffic and adaptive human behavior, Science 179, 918–920 (1973).
- [6] Herman, R. & Prigogine, I. A two-fluid approach to town traffic, Science 204, 148–151 (1979).
- [7] Helbing, D. Verkehrsdynamik. Neue physikalische Modellierungskonzepte (Springer, Berlin, 1997).
- [8] Henderson, L. F. The statistics of crowd fluids, Nature 229, 381–383 (1971).
- [9] Henderson, L. F. Sexual differences in human crowd motion, Nature 240, 353–355 (1972).
- [10] Helbing, D. & Molnár, P. Social force model for pedestrian dynamics, Physical Review E 51, 4282–4286 (1995).
- [11] Haken, H. Advanced Synergetics (Springer, Berlin, 2nd ed., 1987).
- [12] Nicolis, G. & Prigogine, I. Self-Organization in Nonequilibrium Systems. From Dissipative Structures to Order through Fluctuations (Wiley, New York, 1977).
- [13] Schenk, M. Untersuchungen zum Fußgängerverhalten (PhD thesis, University of Stuttgart, 1995).
- [14] Kayser, D. R., Aberle, L. K., Pochy, R. D. & Lam, L. Active walker models: tracks and landscapes, Physica A 191, 17–24 (1992).
- [15] Lam, L. Active walker models for complex systems, Chaos, Solitons & Fractals 6, 267–285 (1995).
- [16] Schweitzer, F. & Schimansky-Geier, L. Clustering of “active” walkers in a two-component system, Physica A 206, 359–379 (1994).
- [17] Schimansky-Geier, L., Mieth, M., Rosé, H. & Malchow, H. Structure formation by active Brownian particles, Physics Letters A 207, 140–146 (1995).
- [18] Ben-Jacob, E. et al. Generic modelling of cooperative growth patterns in bacterial colonies. Nature 368, 46–49 (1994).
- [19] Stevens, A. & Schweitzer, F. Aggregation induced by attractive media, in Mechanisms of Cell and Tissue Motion, ed. by Alt, W., Deutsch, A. & Dunn, G. (Birkhäuser, Basel, 1996).
- [20] Eigen, M. & Schuster, P. The Hypercycle (Springer, Berlin, 1979).
- [21] Feistel, R. and Ebeling, W. Evolution of Complex Systems. Self-Organization, Entropy and Development (Kluwer, Dordrecht, 1989).
- [22] Timmermans, H., van der Hagen, X. & Borgers, A. Transportation systems, retail environments and pedestrian trip chaining behaviour: Modelling issues and applications, Transportation Research B 26, 45–59 (1992).
- [23] Hillier, B. Space is a Machine: A Configurational Theory of Architecture. (Cambridge University Press, Cambridge, 1996).
2.1. ACKNOWLEDGMENTS
The authors would like to thank Frank Schweitzer for many stimulating discussions. Wolfgang Weidlich and Martin Treiber were helpful in reviewing the manuscript.
2.2. FIGURES

FIG. 1. Between the straight, paved ways on the university campus in Stuttgart-Vaihingen a trail system has evolved (center of the picture). Two types of nodes are observed: Intersections of two trails running in a straight line and junctions of two trails which smoothly merge into one trail.

FIG. 2. The structure of the emerging trail system (light grey) essentially depends on the attractiveness parameter . If is small, a direct way system develops (left), if is large, a minimal way system is formed, otherwise a compromise between both extremes will result (middle) which looks similar to the trail system in the center of Figure 1.

FIG. 3. The graphics illustrate the places and walking directions of pedestrians by arrows. The trail potential is represented by a color scale (red = small, blue = large values). Starting with a plain ground, the structure of the trail system changes considerably during the simulation. Initially, pedestrians use the direct ways (left). Since frequently used trails become more comfortable, a bundling of trails sets in which reduces the overall length of the trail system (right). The resulting way system (whose asymmetry is caused by differences in the frequency of trail usage) could serve as a planning guideline. It provides a suitable compromise between minimal construction costs and maximal comfort. Moreover, it balances the relative detours of all walkers.

An aerial photograph of the University Campus of Brasilia. The image shows a large, open green area with a network of dirt trails winding through it. In the background, several modern, multi-story buildings are visible. The trails appear to be formed by pedestrian traffic, showing a clear pattern of movement across the landscape.
FIG. 4. When pedestrians leave footprints on the ground, trails will develop, and only parts of the ground are used for walking (in contrast to paved areas). The similarity between the simulation result (left) and the trail system of the university campus of Brasilia (right, reproduction by kind permission of Klaus Humpert) is obvious.

A vertical simulation result showing a network of trails. The background is dark, and the trails are represented by yellow and green areas. White dots are scattered along the trails, representing individual pedestrian footprints. The pattern of trails and footprints closely matches the network of dirt trails seen in the aerial photograph of the University Campus of Brasilia.