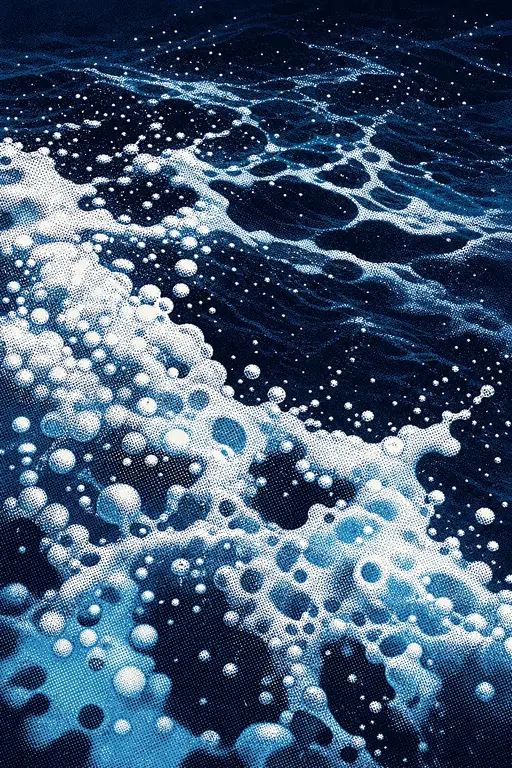
Very Fast Real-Time Ocean Wave Foam Rendering Using Halftoning
1. Very Fast Real-Time Ocean Wave Foam Rendering Using Halftoning
Mary Yingst, Jennifer R. Alford, and Ian Parberry
Technical Report LARC-2011-05
Laboratory for Recreational Computing
Department of Computer Science & Engineering
University of North Texas
Denton, Texas, USA
June 2011

The logo for the University of North Texas. It features the letters "UNT" in a large, bold, stylized font. Below "UNT" are the words "UNIVERSITY OF" and "NORTH TEXAS" in a smaller, sans-serif font. A small star is positioned between "NORTH" and "TEXAS". At the bottom, the tagline "Discover the power of ideas." is written in a small, italicized font.
2. Very Fast Real-Time Ocean Wave Foam Rendering Using Halftoning
Mary Yingst
Dept. of Computer
Science & Engineering
University of North Texas
maryyingst@my.unt.edu
Jennifer R. Alford
Digital Teapot, Inc.
gralford@acm.org
Ian Parberry
Dept. of Computer
Science & Engineering
University of North Texas
ian@unt.edu
2.1. ABSTRACT
We introduce an efficient method for emulating sea foam dissipation suitable for use in real-time interactive environments such as video games. By using a pre-computed dither array with controlled spectral characteristics adopted from halftone research as a control mechanism in the pixel shader, we can animate the appearance of foam bubbles popping in a random manner while allowing them to clump naturally.
2.2. Introduction
Real-time animation and rendering of ocean waves is often seen in video games, and adding foam to the waves lends an added level of realism. We describe a fast and effective method for rendering ocean wave foam by augmenting traditional texture based foam saturation methods with techniques from halftoning.
Takahashi et al. [6] and Thürey et al. [7] represent foam as a particle system. Although this is visually pleasing, it is computationally intensive. In large scale environments such as the ocean it is more practical to use faster texture based methods. Many methods of rendering foam rely on applying a texture of foam to the water surface. These methods apply a texture using a foam saturation, or density value to represent transparency of the texture which is applied to a mesh representing the water's surface (see, for example, Jensen and Goliás [2], Jeschke, Birkholz and Schmann [3], and Kryachko [4]). Li, Jin, Yin, and Shen [5] similarly apply a foam color according to its density.
Real ocean foam consists of bubbles clumped together by surface tension on the surface of the water. Foam does not simply fade or become transparent as the bubbles dissipate. Traditional methods of foam generation ignore the active nature of foam density where bubbles pop over time. Since surface bubbles are either present or not in an area of water, this binary nature lends itself to the use of halftoning, a process used to reproduce images using patterns of black dots. Our use of halftoning with a saturation function that changes over time causes
bubbles to appear to pop.
The remainder of this note is divided into five sections. First we give a high-level overview of our approach. Then we review in more depth our choice of foam saturation function, our use of a halftoning mask generated using methods from the halftoning literature, and how we apply that mask in a pixel shader. Finally we conclude with a discussion of our results.
2.3. Overview of Our Approach
To generate foam on the surface of the water using a foam saturation function, we must create the water surface as a mesh. Each location on the water's surface has a calculable saturation value using this function. The function must vary over time for the foam to animate and become more and less dense as waves pass and change. In figure 1 we see that by applying halftoning methods to a saturation function, we take an otherwise smooth area of the function and create the randomness expected when foam generates and dissipates. Halftone

Figure 1: By replacing the application of a foam texture with a white tone we see that applying our method creates randomness on the right in the otherwise smooth saturation results pictured on the left.
masks, or dither arrays, are arrays of values that have a one-to-one correspondence with pixels in an image, or in our application, a texture. Each value of the halftone mask is used as a threshold against the corresponding texture pixel to produce a binary output image that indicates, at each pixel position, whether the texture falls above or below the threshold. This process is commonly referred to as thresholding. Halftone masks are characterized by the binary pattern that results when thresholded against a constant image, or texture. Choosing threshold value values at each mask position is non-trivial. Ulichney [8] provides a classic study of mask design and describes widely used metrics, based on the Fourier Transform, to characterize masks by their radially averaged power spectrum (RAPS), a measure of energy at different frequency bands, and anisotropy, a measure of radial symmetry. While halftoning can be accomplished with a variety of computational methods, we restrict ourselves to the use of masks because, as point operations, they are computationally efficient and naturally suited to pixel shader operations.
We depart from the traditional use of halftoning in printing and image display, which seeks to reduce visually objectionable noise in image reproduction, and instead we use a halftone mask to add noise. We draw on recent work in halftone mask design by observing that it is possible to design masks to produce lumping binary patterns which are reminiscent of the clumping of sea foam. We also observe that the binary nature of the threshold output is well-suited to simulate foam bubble popping when the mask is fixed per frame but the underlying image is not. In this work, we present a novel way to use halftone masks in conjunction with a saturation function and a texture to simulate foam and the popping behavior of foam. Further, we observe that the difference between the threshold value and an image or a texture provides a magnitude at each pixel position that we use as a transparency value for additional realism.
We use halftone masks that have been generated using a symmetric Gaussian function to filter white noise as described in Alford and Sheppard [1]. Gaussian filtering applies a two-dimensional Gaussian function to an image. is a value in the Gaussian function that denotes the width of the curve in the function; as increases, the width of the curve increases.
We simulate the effect of foam bubbles popping by finding the saturation of foam on the water's surface and applying a precomputed halftone mask to it. We use a modified version of the vertex shader outlined in a paper by Van Dresek III, Bookout, and Lake [9] to create parametric waves upon which to apply our foam. The next two sections will describe the saturation function and the halftone mask in more detail.
2.3.1. The Saturation Function
Kryachko [4] uses the following foam saturation function which is dependent on ocean height. is base height, is height, and is height where foam is
maximum.

Figure 2: Foam with Kryachko's saturation function.
Although Kryachko's function achieves somewhat attractive results (see Figure 2 for example), the function results in a symmetric foam distribution, whereas we wish to model foam that is created by turbulence at the front of the wave and fades away behind it. Knowing the target foam density along the wave shape, we chose to apply to the same vector and frequency used to determine wave shape.

Figure 3:
We use the following formulae from Van Dresek III, Bookout, and Lake [9] for the height of the wave:
and so we use to also generate the periodic function.
where is position, is the wave direction, is the speed of the wave, is time, is wave slope, is wave amplitude, is wavelength adjusted for ocean depth, and is original wavelength.
Since we are overlaying this function on the sine function that determines wave shape, we need to modify the formula slightly to align the foam with the waves. In
Figure 3 we see that is twice as frequent as , so we divide by 2. Also to align the highest part of our function with the front part of the sine wave we add . Our final formula is as follows, and gives a attractive saturation of foam starting at the wave front and fading behind it.
where is a user defined constant that governs the intensity of the foam. (We use for convenience, but this value may be tuned by the designer.)
Saturation is computed as follows. Adjwavelength, and phaseC are calculated in the vertex shader and the values are interpolated for use in the pixel shader.
float getmysaturation(float2
    wavedirection, float2 xzposition,
    float Adjwavelength, float phaseC)
{
    float result =
        dot(wavedirection, xzposition)
        *6.28f/Adjwavelength;
    result = result + phaseC*gTimeNow;
    result = pow(2.718f,-1.0f*
        tan((result/2.0f)+ 1.07f))/4.0f;
    return result;
}
To pass values from the vertex shader we simply define an extra variable in the vertex output with a TEXCOORD semantic. Then the vertex shader sets the required values as follows:
struct VertexOutput
{
    ...
    float4 impVars : TEXCOORD4;
}

VertexOutput VS(...)
{
    VertexOutput OUT = (VertexOutput)0;
    ...
    OUT.impVars[1]=adjustedWavelength;
    OUT.impVars[0]=phaseConstant;
    OUT.impVars[2] = Po[0]; //xposition
    OUT.impVars[3] = Po[2]; //zposition
}

float4 PS(VertexOutput IN) : COLOR
{
    float saturated=getmysaturation
        (direction, float2(IN.impVars[2],
        IN.impVars[3]), IN.impVars[1],
        IN.impVars[0]);
    ...
}
2.3.2. The Halftone Mask
We use a halftone mask to threshold the saturation function to create dissipation through bubble popping. As
saturation decreases over time at a specific location, the value will approach and pass the threshold used in our mask. While the saturation value is above the threshold, the foam will be present, but as time passes and the value decreases, eventually the foam will pop and disappear. Since bubbles in foam clump, we must choose a halftone mask that produces clumps in the resulting dot patterns. Clumpiness, or clustering, can be seen in how close together some of the foam is while in other areas there are gaps.
Alford and Sheppard [1] show a variety of halftone masks created using radially symmetric Gaussian filters. We used their masks created using filters having ranging from 1.5 to 24 to produce the images in Figure 4 column 1. In Figure 4 we can see that the higher the , the closer together some of the dots are. By analyzing the RAPS we see that as increases, first oscillation is dampened in the high frequencies, then the values of the high frequency region is greatly reduced (Alford and Sheppard [1]). The results of this can be seen in the increased clustering and clumping behavior of the dot patterns. We found gives adequate visual clusters of foam.

Figure 4: Halftone masks created by Gaussian filters having ranging from 1.5 to 24, with corresponding RAPS (images courtesy Alford and Sheppard [1]).
2.3.3. Applying the Mask
To create the halftoned saturation function where are texture coordinates and is a float4 RGBA color value at that position, we first create a texture to contain the mask information so that the data can be imported into the pixel shader. Given a halftone mask, a pixel texture is generated. This texture, when tiled across the surface of the water, has a corresponding texture coordinate for each position on the water. The mask value can then be used to threshold the saturation function as follows:

Figure 5: Applying Equation 1 to the saturation function at left gives the image at right.
We can then create a fading halftoned saturation function, , so the dots fade before they pop. We do this by taking the difference between saturation and mask number. Figure 1 shows the results of applying halftoning with fading to the saturation function.
Finally we apply , the foam texture to generate the final halftoned, textured, and faded image .

Figure 6: Coastline image using our new halftoning method, Equation 3.
Given a sampler for the halftone mask texture, MaskSampler; a sampler for the foam texture, SAMP_FoamTexture; and a sampler for the water surface texture, SAMP_WaterTexture; the following code finds the resulting color for the water's surface. The higher TEXscale or MASKscale is, the smaller the tiled texture will appear. A value of 400 for MASKscale gives suitably sized dots when using a pixel mask.
//get water and foam texture color
float4 textureSamp = tex2D(
    SAMP_WaterTexture,
    IN.TexCoord1*TEXscale);
float4 foamSamp = tex2D(
    SAMP_FoamTexture,
    IN.TexCoord1*TEXscale);

//get the threshold from the mask
float masknumber=(tex2Dlod(
    MaskSampler, float4(IN.TexCoord1.xy
    *MASKscale, 0, 0)));

//threshold the saturation value
if (!((saturated)>(masknumber))){
    foamSamp[0] = 0;
    foamSamp[1] = 0;
    foamSamp[2] = 0;
}

//find the value for fading the foam
float difference = clamp(saturated
    - masknumber, 0.15f, 3.0f);
//get the final foam value
foamSamp = difference * foamSamp;

//add the value to the water texture
//and clamp to a valid color
float4 result =clamp((textureSamp+
    foamSamp),0,1);
result[3] = 1.0f;
2.4. Results
Figure 7(a) shows the traditional method of fading a foam texture according to a saturation function, similar to Kryachko [4]. Figure 7(b) shows the saturation halftoned using Equation 1 and no other functions applied. This method shows a realistic popping effect, but the foam is too harsh and white. Figure 7(c) shows our halftoning method in combination with a foam texture using Equation 3.

(a) Using a foam texture.

(b) Using a halftone mask to determine foam location.

(c) Using a halftone mask with a foam texture.
Figure 7: The results of using 3 different methods with the same settings (heightmap, wave speed, direction, and amplitude).
| Graphics Card | Textured | Halftoned |
|---|---|---|
| NVidia 8800 | 65.5fps | 65.0fps |
| NVidia GeForce GT320m | 80.4fps | 78.2fps |
| Intel HD Graphics 3000 | 85.0fps | 84.5fps |
Table 1: Comparison of rendering frame rates in frames per second (fps).

Figure 8: Scene used for measuring frame rates.
We performed some experiments to obtain a preliminary benchmark for the extra computation load required by our new halftoning technique (Figure 7(c)) to the traditional texturing technique (Figure 7(a)). We ran both algorithms for five minutes using NVidia Composer, using FRAPS to measure average frames-per-second. The scene rendered in all experiments is shown in Figure 8. The results are shown in Table 1. We conclude that the extra load on the video appears to be less than 3% higher than traditional texture-fading techniques, which is negligible.
Still pictures such as shown in Figure 7 and Figure 8 do not adequately capture the full effect of our algorithm. Figure 9 shows how foam bubbles fade and pop over time in the wake of each wave. This can be seen to best advantage in an animation such as the one we have placed online at [10].

Figure 9: Close up view of foam bubbles fading and popping over time.
2.5. Conclusion and Further Work
Not only does our halftoning technique achieve our goal of simulating foam dissipation in a real-time environment, but it also can be applied with little additional cost to traditional texture based methods that obtain foam saturation at the water's surface. The saturation function used must vary over time for the bubble popping effect to occur using the halftoning method.
Our method currently produces pixelation at close range to the camera. One method for remedying this would be a second pass of a pixel shader to smooth the edges of the generated texture, which we leave as future work.
2.6. References
- [1] Jennifer R. Alford and David G. Sheppard. "Approximating Poisson Disk Distributions by Means of a Stochastic Dither Array". In: EG UK Theory and Practice of Computer Graphics. 2010.
- [2] Lasse Staff Jensen and Robert Goliás. Deep-Water Animation and Rendering. Presented at Game Developers Conference, Europe. 2001. URL: www.gamasutra.com/gdce/2001/jensen/jensen_01.htm.
- [3] S. Jeschke, H. Birkholz, and H. Schmann. "A Procedural Model for Interactive Animation of Breaking Ocean Waves". In: Proceedings of WSCG 2003. WSCG. 2003.
- [4] Yuri Kryachko. "Using Vertex Texture Displacement for Realistic Water Rendering". In: GPU Gems 2: Programming Techniques for High-Performance Graphics and General-Purpose Computation (2005).
- [5] Yongjin Li et al. "Simulation of shallow-water waves in coastal region for marine simulator". In: Proceedings of The 7th ACM SIGGRAPH International Conference on Virtual-Reality Continuum and Its Applications in Industry. ACM, 2008, 15:1-15:5.
- [6] Tsunemi Takahashi et al. "Realistic Animation of Fluid with Splash and Foam". In: Computer Graphics Forum 22.3 (2003), pp. 391-400.
- [7] N. Thürey et al. "Real-time simulations of bubbles and foam within a shallow water framework". In: Proceedings of the 2007 ACM SIGGRAPH Eurographics Symposium on Computer Animation. Eurographics Association, 2007.
- [8] Robert Ulichney. Digital Halftoning. Cambridge, Mass: The MIT Press, 1987.
- [9] J. Van Drasek III, D. Bookout, and A. Lake. Real-Time Parametric Shallow Wave Simulation. 2010. URL: http://software.intel.com/en-us/articles/real-time-parametric-shallow-wave-simulation/.
- [10] Mary Yingst, Jennifer R. Alford, and Ian Parberry. Sea Foam. 2011. URL: http://larc.unt.edu/ian/research/seafoam/.
2.7. BIBLIOGRAPHY
MARY YINGST is an MS student in the Department of Computer Science and Engineering at the University of North Texas. Her research interests include graphics for game development.
JENNIFER R. ALFORD is President of Digital Teapot, Inc. and a Research Associate in the Laboratory for Recreational Computing at the University of North Texas. Her research interests include halftoning.
IAN PARBERRY is a Professor in the Department of Computer Science and Engineering at the University of North Texas. With over 30 years experience in research and education, he helped pioneer the academic study of game development in 1993. His undergraduate game development program was ranked in the top 50 out of 500 in North America by The Princeton Review in 2010. He is on the Editorial Boards of the Journal of Computer Game Design and Development, IEEE Transactions On Computational Intelligence and AI In Games, and Entertainment Computing, and serves as the Secretary of the Society for the Advancement of the Science of Digital Games, which organizes the Annual Foundations of Digital Games conference.